Changes that have landed in master but are not yet released. Click to see more.
- Re-enabled "copy" prop/state/hooks context menu option for Firefox (bvaughn,rpl in #17740)
- Shift+Enter focuses previous search result in Components tree (Bo-Duke in #17005)
- Properly display formatted
RegExpvalues in props/state panel(bvaughn in #17690) - Profiler commit selector wraps around for easier navigation of large profiles (bvaughn in #17760)
- Check
document.contentTypebefore injecting hook to avoid breaking XML file syntax highlighting in Firefox (bvaughn in #17739) - Fix standalone UI not responding to mouse interactions due to
webkit-app-regionstyle (cwatson88 in #17584) - Support inspecting object values with null protos (bvaughn in #17757)
- Support inspecting values that have overridden
hasOwnPropertyattribute (bvaughn in #17768) - Fixed regression that made Profiler "Could not find node…" error happen more frequently (bvaughn in #17759)
- Show component location for selected element in bottom/right panel (bvaughn in #17567)
- Improved inspected element values with inline previews (bvaughn in #17579)
- Improved selection and toggling for inspected element panel (bvaughn in #17588)
- Copy context menu for inspecting and copying props/state/hooks/context values (bvaughn in #17608)
- Fix serialization for
BigInttype so that it does not break inspection panel. (nutboltu in #17233) - Fix display name logic for
forwardRefs that usedisplayNameproperty (zthxxx in #17613)
- Profiler automatically filters certain types of empty (no work) commits. (bvaughn in #17253)
- Fix memoized components showing as "Anonymous" in Components tab. (wsmd in #17274)
- Edge-case bugfix for non-string element keys. (bvaughn in #17164)
- "Highlight updates" feature added for browser extensions and
react-devtools-inlineNPM package. (bvaughn in #16989)
- Fixed regression where DevTools wouldn't properly connect with apps when using the
file://protocol. (linshunghuang in #16953)
- Fixed bug where Components panel was always empty for certain users. (linshunghuang in #16900)
- Fixed regression in DevTools editable hooks interface that caused primitive values to be shown as
undefined. (bvaughn in #16867) - Fixed bug where DevTools showed stale values in props/state/hooks editing interface. (bvaughn in #16878)
- Show unsupported version dialog with downgrade instructions. (bvaughn in #16897)
- Props/state editor supports adding new values and changing value types. (hristo-kanchev in #16700)
- Profiler correctly saves/exports profiling data in Firefox now. (hristo-kanchev in #16612)
- Class components now show "legacy context" header (rather than "context") for legacy API. (hristo-kanchev in #16617)
- Show component source button ("<>") now highlights the
rendermethod for class components. (theKashey in #16759) - Bugfix for components with non-standard object values for
function.name. (LetItRock in #16798)
- Remove ⚛️ emoji prefix from Firefox extension tab labels
- Standalone polyfills
Symbolusage
- Props, state, and context values are alpha sorted.
- Standalone DevTools properly serves backend script over localhost:8097
- Bugfix for potential error if a min-duration commit filter is applied after selecting a fiber in the Profiler UI.
- ES6
MapandSet, typed arrays, and other unserializable types (e.g. Immutable JS) can now be inspected. - Empty objects and arrays now display an "(empty)" label to the right to reduce confusion.
- Components that use only the
useContexthook now properly display hooks values in side panel. - Style editor now supports single quotes around string values (e.g. both
"red"and'red'). - Fixed edge case bug that prevented profiling when both React v16 and v15 were present on a page.
- Removed unnecessary
webNavigationpermission from Chrome and Firefox extensions.
- Removed unnecessary
<all_urls>,background, andtabspermissions from Chrome and Firefox extensions.
The legacy DevTools extension used to add significant performance overhead, making it unusable for some larger React applications. That overhead has been effectively eliminated in version 4.
Learn more about the performance optimizations that made this possible.
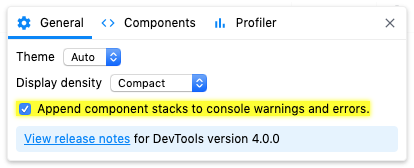
React component authors have often requested a way to log warnings that include the React "component stack". DevTools now provides an option to automatically append this information to warnings (console.warn) and errors (console.error).

It can be disabled in the general settings panel:
Large component trees can sometimes be hard to navigate. DevTools now provides a way to filter components so that you can hide ones you're not interested in seeing.
Host nodes (e.g. HTML <div>, React Native View) are now hidden by default, but you can see them by disabling that filter.
Filter preferences are remembered between sessions.
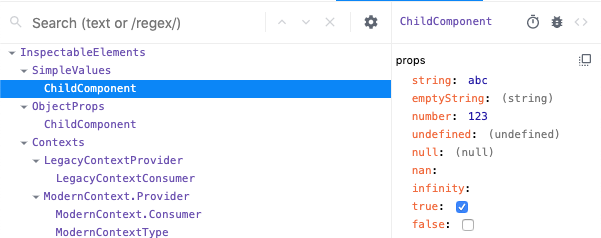
Components in the tree no longer show inline props. This was done to make DevTools faster and to make it easier to browse larger component trees.
You can view a component's props, state, and hooks by selecting it:
In React, an element's "owner" refers to the thing that rendered it. Sometimes an element's parent is also its owner, but usually they're different. This distinction is important because props come from owners.
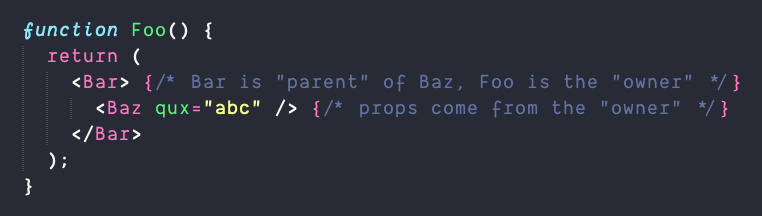
When you are debugging an unexpected prop value, you can save time if you skip over the parents.
DevTools v4 adds a new "rendered by" list in the right hand pane that allows you to quickly step through the list of owners to speed up your debugging.
The inverse of the "rendered by" list is called the "owners tree". It is the list of things rendered by a particular component- (the things it "owns"). This view is kind of like looking at the source of the component's render method, and can be a helpful way to explore large, unfamiliar React applications.
Double click a component to view the owners tree and click the "x" button to return to the full component tree:
Deeply nested components used to require both vertical and horizontal scrolling to see, making it easy to "get lost" within large component trees. DevTools now dynamically adjusts nesting indentation to eliminate horizontal scrolling.
Hooks now have the same level of support as props and state: values can be edited, arrays and objects can be drilled into, etc.
Legacy DevTools search filtered the components tree to show matching nodes as roots. This made the overall structure of the application harder to reason about, because it displayed ancestors as siblings.
Search results are now shown inline similar to the browser's find-in-page search.
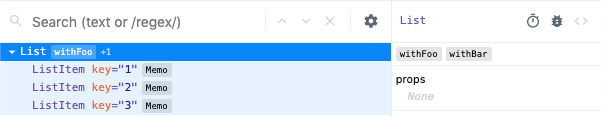
Higher order components (or HOCs) often provide a custom displayName following a convention of withHOC(InnerComponentName) in order to make it easier to identify components in React warnings and in DevTools.
The new Components tree formats these HOC names (along with several built-in utilities like React.memo and React.forwardRef) as a special badge to the right of the decorated component name.
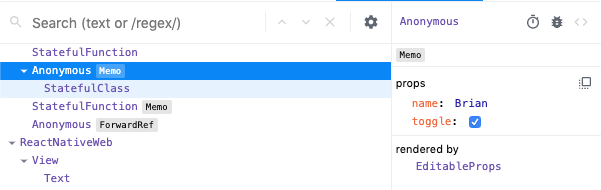
Components decorated with multiple HOCs show the topmost badge and a count. Selecting the component shows all of the HOCs badges in the properties panel.
DevTools now attempts to restore the previously selected element when you reload the page.

React's experimental Suspense API lets components "wait" for something before rendering. <Suspense> components can be used to specify loading states when components deeper in the tree are waiting to render.
DevTools lets you test these loading states with a new toggle:
The profiler is a powerful tool for performance tuning React components. Legacy DevTools supported profiling, but only after it detected a profiling-capable version of React. Because of this there was no way to profile the initial mount (one of the most performance sensitive parts) of an application.
This feature is now supported with a "reload and profile" action:
Profiler data can now be exported and shared with other developers to enable easier collaboration.
Exports include all commits, timings, interactions, etc.
"Why did this render?" is a common question when profiling. The profiler now helps answer this question by recording which props and state change between renders.
Because this feature adds a small amount of overhead, it can be disabled in the profiler settings panel.
The profiler now displays a list of each time the selected component rendered during a profiling session, along with the duration of each render. This list can be used to quickly jump between commits when analyzing the performance of a specific component.