Skip to content
New issue

Have a question about this project? Sign up for a free GitHub account to open an issue and contact its maintainers and the community.

By clicking “Sign up for GitHub”, you agree to our terms of service and privacy statement. We’ll occasionally send you account related emails.

Already on GitHub? Sign in to your account

dockerd: high memory usage #848

Closed
2 of 3 tasks
ceecko opened this issue Nov 8, 2019 · 26 comments
Closed
2 of 3 tasks

dockerd: high memory usage #848

ceecko opened this issue Nov 8, 2019 · 26 comments

Comments

@ceecko
Copy link

ceecko commented Nov 8, 2019

  • This is a bug report
  • This is a feature request
  • I searched existing issues before opening this one

Expected behavior

dockerd should use less memory

Actual behavior

dockerd uses 4.5GB+ memory

Steps to reproduce the behavior

Not sure. We run multiple servers with docker and all of them experience high memory usage after some time.

I'm happy to provide any debugging logs as needed.

Output of docker version:

Client: Docker Engine - Community
 Version:           19.03.3
 API version:       1.40
 Go version:        go1.12.10
 Git commit:        a872fc2f86
 Built:             Tue Oct  8 00:58:10 2019
 OS/Arch:           linux/amd64
 Experimental:      false

Server: Docker Engine - Community
 Engine:
  Version:          19.03.1
  API version:      1.40 (minimum version 1.12)
  Go version:       go1.12.5
  Git commit:       74b1e89
  Built:            Thu Jul 25 21:19:36 2019
  OS/Arch:          linux/amd64
  Experimental:     false
 containerd:
  Version:          1.2.10
  GitCommit:        b34a5c8af56e510852c35414db4c1f4fa6172339
 runc:
  Version:          1.0.0-rc8+dev
  GitCommit:        3e425f80a8c931f88e6d94a8c831b9d5aa481657
 docker-init:
  Version:          0.18.0
  GitCommit:        fec3683

Output of docker info:

Client:
 Debug Mode: false

Server:
 Containers: 171
  Running: 147
  Paused: 0
  Stopped: 24
 Images: 140
 Server Version: 19.03.1
 Storage Driver: overlay2
  Backing Filesystem: xfs
  Supports d_type: true
  Native Overlay Diff: true
 Logging Driver: journald
 Cgroup Driver: cgroupfs
 Plugins:
  Volume: local
  Network: bridge host ipvlan macvlan null overlay
  Log: awslogs fluentd gcplogs gelf journald json-file local logentries splunk syslog
 Swarm: inactive
 Runtimes: runc
 Default Runtime: runc
 Init Binary: docker-init
 containerd version: b34a5c8af56e510852c35414db4c1f4fa6172339
 runc version: 3e425f80a8c931f88e6d94a8c831b9d5aa481657
 init version: fec3683
 Security Options:
  seccomp
   Profile: default
 Kernel Version: 3.10.0-1062.1.2.el7.x86_64
 Operating System: CentOS Linux 7 (Core)
 OSType: linux
 Architecture: x86_64
 CPUs: 12
 Total Memory: 31.05GiB
 Name: kkk
 ID: 6VZX:5BMH:3O4I:PU5H:YPVC:FYEN:VZUT:O5RW:PMU2:F7K6:DS44:DTWT
 Docker Root Dir: /data/docker
 Debug Mode: false
 Registry: https://index.docker.io/v1/
 Labels:
 Experimental: false
 Insecure Registries:
  127.0.0.0/8
 Live Restore Enabled: true

WARNING: bridge-nf-call-iptables is disabled
WARNING: bridge-nf-call-ip6tables is disabled

Additional environment details (AWS, VirtualBox, physical, etc.)

  • physical server
  • API is used to control docker
  • logging is done to fluentd
  • no mounts are used
  • each container exposes one port
  • there's plenty of containers which are automatically restarted due to errors on startup (not related to docker) until restart limit is hit and are then stopped (~20-25 containers)
  • This appears in the logs pretty often
time="2019-11-08T13:38:15.333931156+01:00" level=info msg="ignoring event" module=libcontainerd namespace=moby topic=/tasks/delete type="*events.TaskDelete"
@andrewhsu
Copy link
Contributor

@ceecko could you provide steps to reproduce? With current description of the issue, hard to nail down what is happening on your system.

@ceecko
Copy link
Author

ceecko commented Nov 12, 2019

@andrewhsu I understand. I don't have any specific steps. We run tens of servers with 32GB of memory where containers come and go and all of them experience this high memory usage over time. Usually within 2-4 weeks.

Is there any debugging information I can get you to see what's using the memory?

@ceecko
Copy link
Author

ceecko commented Nov 16, 2019

@andrewhsu I managed to replicate the issue. After running the following script the memory usage jumps to 262MB. It appears fluentd-async-connect=true is responsible for this.

Fluentd runs ok and accepts logs. Removing all containers does not decrease the memory usage.

#!/bin/bash
for i in {1..10}
do
  docker run -d \
    --restart always \
    --log-driver=fluentd \
    --log-opt fluentd-address=127.0.0.1:2222 \
    --log-opt fluentd-async-connect=true \
    debian sleep 2 &
done

@ceecko
Copy link
Author

ceecko commented Dec 1, 2019

@andrewhsu is there any other information which would be useful?

@kolyshkin
Copy link

@ceecko can you please collect memory usage dumps and share it with us? The following article explains how to do that: https://success.docker.com/article/how-do-i-gather-engine-heap-information

@ceecko
Copy link
Author

ceecko commented Dec 18, 2019

Attached you can find the files
pprof.dockerd.alloc_objects.alloc_space.inuse_objects.inuse_space.001.pb.gz
pprof.dockerd.alloc_objects.alloc_space.inuse_objects.inuse_space.002.pb.gz

There appears to be an error in the output

[root@docker ~]# docker run --rm --net host -v $PWD:/root/pprof/ golang go tool pprof --svg --alloc_space localhost:8080/debug/pprof/heap
Fetching profile over HTTP from http://localhost:8080/debug/pprof/heap
Saved profile in /root/pprof/pprof.dockerd.alloc_objects.alloc_space.inuse_objects.inuse_space.001.pb.gz
failed to execute dot. Is Graphviz installed? Error: exec: "dot": executable file not found in $PATH
[root@docker ~]# docker run --rm --net host -v $PWD:/root/pprof/ golang go tool pprof --svg --inuse_space localhost:8080/debug/pprof/heap
Fetching profile over HTTP from http://localhost:8080/debug/pprof/heap
Saved profile in /root/pprof/pprof.dockerd.alloc_objects.alloc_space.inuse_objects.inuse_space.002.pb.gz
failed to execute dot. Is Graphviz installed? Error: exec: "dot": executable file not found in $PATH

@davidschrooten
Copy link

I am running into a similar problem on one of my kubernetes clusters. After 4 weeks memory consumption of dockerd is climbing from 1.5 gigabyte to 54 gigabyte. Only a reboot temporary solves the problem. Docker commands such as docker stats also become unresponsive when the memory usage starts rising. This happens on 18.06.2-ce on debian stretch. Problem does not happen on another cluster composed out of nodes that run coreos; which have the same deployments.

@cpuguy83
Copy link
Collaborator

@ceecko Thanks for the dump. It seems like this only has a very small portion and shows 25MB of allocated objects.

The reason the svg is not working for you is the golang image does not have graphviz installed, which is what is used to generate that svg.

@ceecko
Copy link
Author

ceecko commented Dec 30, 2019

The dump has been taken at a time when dockerd was using ~220MB of memory after running the provided script.

Maybe I'm reading the output of top wrong? Here it shows 11.3% from 32GB

MiB Mem :  31901.1 total,   1789.1 free,  25112.8 used,   4999.2 buff/cache
MiB Swap:   5118.0 total,   4800.5 free,    317.5 used.   6379.9 avail Mem

  PID USER      PR  NI    VIRT    RES    SHR S  %CPU %MEM     TIME+ COMMAND
15625 root      20   0 7957.0m   3.5g  21.0m S   2.0 11.3   1061:05 dockerd

@srstsavage
Copy link

srstsavage commented Feb 5, 2020

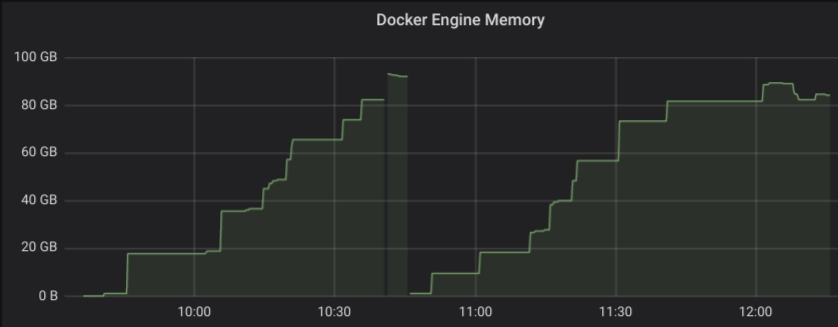
I can confirm this memory leak. Each container deployment with fluentd-async-connect set to true causes dockerd to consume memory which is never released. With fluentd-async-connect set to false no problem occurs.

Here's a Grafana graph of dockerd memory usage (process_resident_memory_bytes from the /metrics endpoint):

chrome-capture

In our case this leads to dockerd being killed by the OS due to oom.

Also, this seems to be a regression: only 19.x docker engines seem to be affected. 18.x dockerds are not affected.

pprof results: dockerd_fluentd_async_leak.tar.gz

Tested with:

  • Debian 8, 9, and 10
  • Docker 19.03.5 (affected), 19.03.4 (affected), 18.09.0 (not affected), 18.06.3-ce (not affected),

I'm also seeing similar pprof results as @ceecko; the memory usage reported by the pprof output (at least the svgs) is much lower than the memory usage reported by the OS and Docker's own /metrics.

@ceecko
Copy link
Author

ceecko commented Mar 8, 2020

@thaJeztah is there any other information you need?

@gotamilarasan
Copy link

We are also facing a similar problem where docker daemon consumes 5GB+ of data, but the go pprof heap shows only ~1GB and it is caused by log driver.

docker_heap.pb.gz
docker_cpu.pb.gz

Steps to reproduce the behavior
I could reproduce the problem when starting a docker container running java and immediately tailing the logs of that container. I can not share the image because it is confidential. Let me know if there's anything else I can share that could help you.

top -b -o +%MEM | head 
top - 07:06:31 up 22:04,  2 users,  load average: 1.45, 1.62, 1.26
Tasks: 201 total,   1 running, 200 sleeping,   0 stopped,   0 zombie
%Cpu(s):  0.8 us,  0.5 sy,  0.0 ni, 98.6 id,  0.0 wa,  0.0 hi,  0.0 si,  0.0 st
KiB Mem : 15842444 total,  6400792 free,  7067024 used,  2374628 buff/cache
KiB Swap:        0 total,        0 free,        0 used.  7992948 avail Mem

  PID USER      PR  NI    VIRT    RES    SHR S  %CPU %MEM     TIME+ COMMAND
28920 root      20   0 6927984 5.475g  47228 S   0.0 36.2   0:26.17 dockerd
29700 root      20   0 8120164 902096  20620 S   0.0  5.7   1:29.36 java
free -h
              total        used        free      shared  buff/cache   available
Mem:            15G        6.7G        6.1G        160M        2.3G        7.6G
Swap:            0B          0B          0B

Daemon configuration:

cat /etc/docker/daemon.json
{
  "live-restore": true,
  "log-driver": "local",
  "log-opts": {
    "max-size": "50m",
    "max-file": "5"
  }
}

Docker info:

docker info
Client:
 Debug Mode: false

Server:
 Containers: 1
  Running: 1
  Paused: 0
  Stopped: 0
 Images: 49
 Server Version: 19.03.8
 Storage Driver: overlay2
  Backing Filesystem: <unknown>
  Supports d_type: true
  Native Overlay Diff: true
 Logging Driver: local
 Cgroup Driver: cgroupfs
 Plugins:
  Volume: local
  Network: bridge host ipvlan macvlan null overlay
  Log: awslogs fluentd gcplogs gelf journald json-file local logentries splunk syslog
 Swarm: inactive
 Runtimes: runc
 Default Runtime: runc
 Init Binary: docker-init
 containerd version: b34a5c8af56e510852c35414db4c1f4fa6172339
 runc version: 3e425f80a8c931f88e6d94a8c831b9d5aa481657
 init version: fec3683
 Security Options:
  apparmor
  seccomp
   Profile: default
 Kernel Version: 4.4.0-1072-aws
 Operating System: Ubuntu 16.04.5 LTS
 OSType: linux
 Architecture: x86_64
 CPUs: 8
 Total Memory: 15.11GiB
 Name: <hostname>
 Docker Root Dir: /var/lib/docker
 Debug Mode: false
 Registry: https://index.docker.io/v1/
 Labels:
 Experimental: false
 Insecure Registries:
  127.0.0.0/8
 Live Restore Enabled: true

Additional environment details (AWS, VirtualBox, physical, etc.)

  • AWS EC2 instance
  • Uses local log driver
  • Earlier we had a instance with 4GB memory and caused OOM killing, so switched to a instance type with memory of 16GB for now.

@lmello

@cpuguy83
Copy link
Collaborator

cpuguy83 commented Apr 8, 2020

I think this is related to excessive allocations rather than an actual leak.
Every time we need to reset our decoding logic (short reads, EOF during follow, etc.) we create a new buffer instead of reusing the existing buffer.
I'm working on a patch for this.

@cpuguy83
Copy link
Collaborator

cpuguy83 commented Apr 8, 2020

I believe moby/moby#40796 should fix the problem.

@srstsavage
Copy link

@cpuguy83 Thanks for looking at this. Just to be clear, the inital bug report and my issue description both use the fluentd log driver, and your PR mentions

This only affects json-file and local log drivers.

If that's the case, this issue probably shouldn't be closed by your PR?

@cpuguy83
Copy link
Collaborator

cpuguy83 commented Apr 8, 2020

Right on, I fixed it.

@sparrc
Copy link

sparrc commented Jun 9, 2020

@cpuguy83 Is this issue fixed? Not entirely clear to me if moby/moby#40796 only applies to to json-file and local or if it also affects the fluentd log driver.

I see from the PR that most of the code changes are to local and json-file, but there are also changes to a generic logger utility that may have fixed this fluentd issue? (https://github.com/moby/moby/pull/40796/files#diff-0d16783edb4c661112478f7e13a17694)

@cpuguy83
Copy link
Collaborator

cpuguy83 commented Jun 9, 2020

It is not fixed for fluentd. The logging utility is a shared implementation of a rotating log file used by local and json-file. As you may have guessed, fluentd does not use this.

@flixr
Copy link

flixr commented Nov 30, 2020

Did the fix for json-file land in docker yet?

@thaJeztah
Copy link
Member

@flixr the PR that was linked above is not in docker 19.03 (see moby/moby#41130 (review)), but it's in the docker 20.10 release candidates (GA to be released soon as well)

@gp-Airee
Copy link

Any update on GA?

@thaJeztah
Copy link
Member

docker 20.10 has been release quite some time ago; people on this thread still running into this with the 20.10 (or above) version?

@remram44
Copy link

remram44 commented Jul 7, 2022

I was running docker-ce 5:20.10.14~3-0~ubuntu-focal when I ran into this. Of course it's possible that I mis-diagnosed and this was not the right issue to subscribe to...

It only happened once.

@ceecko
Copy link
Author

ceecko commented Jul 8, 2022

I confirm this is no longer an issue with 20.10.14

@BenasPaulikas
Copy link

BenasPaulikas commented Nov 27, 2022

I confirm 20.10.12 is buggy and 20.10.14 is OK
From 30GB of ram to <1GB

Nice fix! 🎉 🎉
image

@wangw469
Copy link

wangw469 commented Jan 16, 2023

@ceecko @BenasPaulikas

I think another issue moby/moby#43165 related to high memoy usage, and it has been fixed in 20.10.13:

Prevent an OOM when using the “local” logging driver with containers that produce a large amount of log messages moby/moby#43165.

I can reproduce the problem by running (thanks to @aeriksson )

terminal 1

docker run --log-driver local -it --rm --name foo ubuntu sh -c "apt-get update && apt-get install -y nyancat && nyancat"

terminal 2

docker logs -f foo

Sign up for free to join this conversation on GitHub. Already have an account? Sign in to comment
Projects
None yet
Development

No branches or pull requests