We read every piece of feedback, and take your input very seriously.
To see all available qualifiers, see our documentation.
Have a question about this project? Sign up for a free GitHub account to open an issue and contact its maintainers and the community.
By clicking “Sign up for GitHub”, you agree to our terms of service and privacy statement. We’ll occasionally send you account related emails.
Already on GitHub? Sign in to your account
https://developer.apple.com/videos/play/wwdc2021/10180/
사용자 경험을 극대화하기 위해서!
근데 이건 도대체 뭘까?! Dirty + Compressed memory!!
더 알아보기: iOS Memory Deep Dive - https://developer.apple.com/wwdc18/416
// Monitor memory performance with XCTests

func testSaveMeal() {
    let app = XCUIApplication()

    let options = XCTMeasureOptions()
    options.invocationOptions = [.manuallyStart]

    measure(metrics: [XCTMemoryMetric(application: app)], // 타겟 앱 지정
            options: options) {

        app.launch()

        startMeasuring() // ⏱ 측정 시작!

        app.cells.firstMatch.buttons["Save meal"].firstMatch.tap()

        let savedButton = app.cells.firstMatch.buttons["Saved"].firstMatch
        XCTAssertTrue(savedButton.waitForExistence(timeout: 30)) // 측정을 위해 30초 기다림
    }
}
그러고 나면 테스트 옆에 회색 다이아몬드를 눌러서 결과를 확인할 수 있음
평균 값을 baseline으로 지정할 수 있음 -> 다음 테스트와 비교할 수 있음
baseline 보다 높게 나올 경우 테스트 페일됨. 이 지표는 언제 멈추고 코드를 수정해야할지 알려줌. baseline 부터의 편차를 regression 이라고 부름.
앞서 나온 regression 분석을 위한 새로운 도구가 나왔음 Ktrace files, Memory graphs.
Ktrace files: 일반적인 시스템 조사, 렌더링 파이프라인 파악, 메인 쓰레드 행 걸리는 이유 분석 등 다양하게 쓸 수 있음
Visual debugger로 볼 수도 있지만 command line 으로도 확인할 수 있음
아직 뭔지 잘 모르겠음...ㅠ command line 에서 이렇게 활성화 시킬 수 있음. 이렇게 해두면 nonmemroy metric에 대한 ktrace collection과 memory metrc에 대한 memgrph를 사용할 수 있다.
콘솔에 출력는게 많은데 그 중에 주목할 것들은...
예제에서는 퍼포먼스 baseline 기준을 넘지 못했음
첨부된 memgraph가 있음!
자 이렇게 추출한 파일을 보고 메모리 이슈를 분석해봅시다 Leak, Heap size issue 이슈를 살펴봄
Command line tool로 메모리 분석하는 거 더 찾아보려면... iOS Memory Deep Dive - https://developer.apple.com/wwdc18/416
객체를 allocate 하고 deallocate 하지 않은 채로 모든 reference를 잃어버리면 발생함
몇개의 leak이 발생했는지 분석해줌. 아래에는 좀 더 자세한 callstack이 나와있음
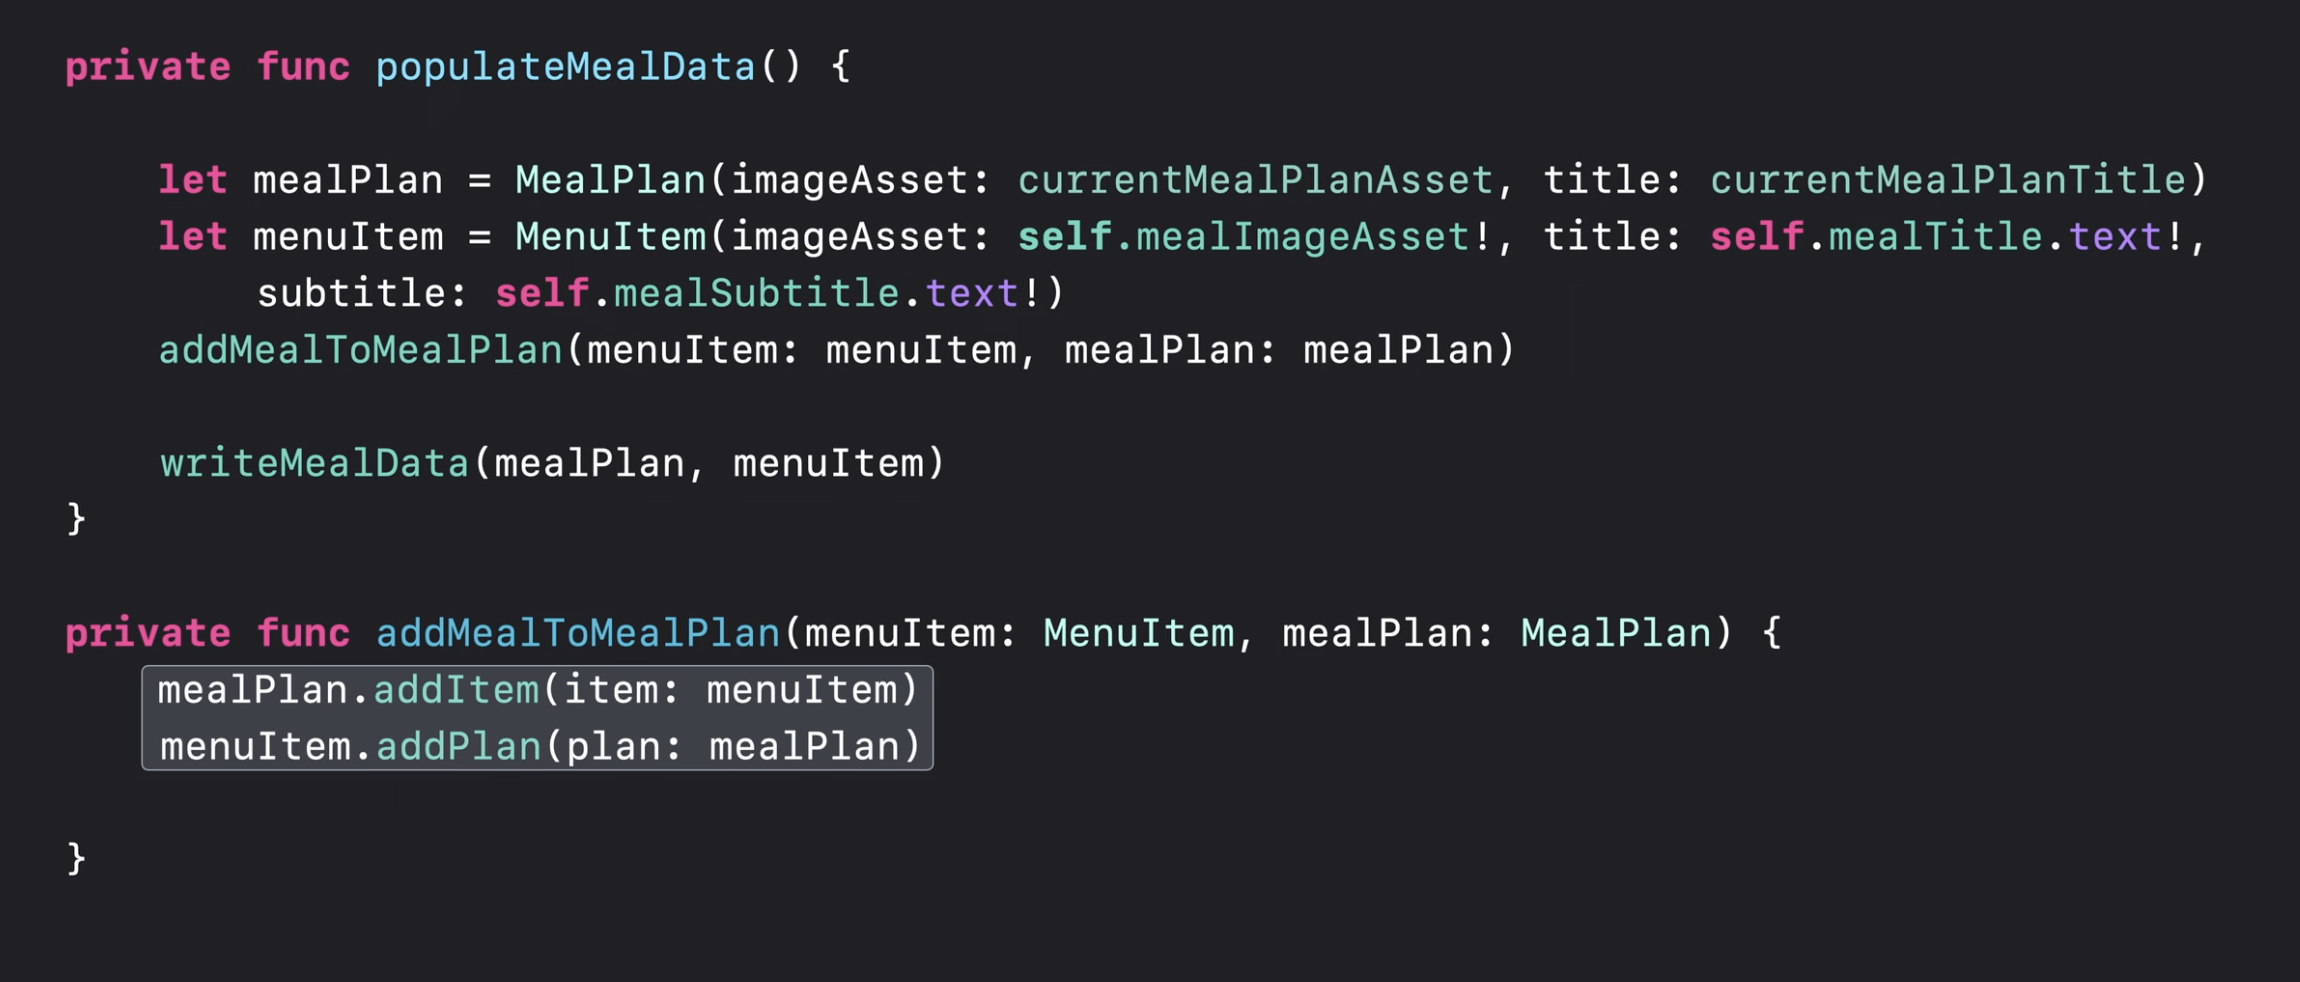
우리 앱에 있는 심볼을 발견할 때가 있음
코드를 들어가보면 서로 참조 하고 있음 :)
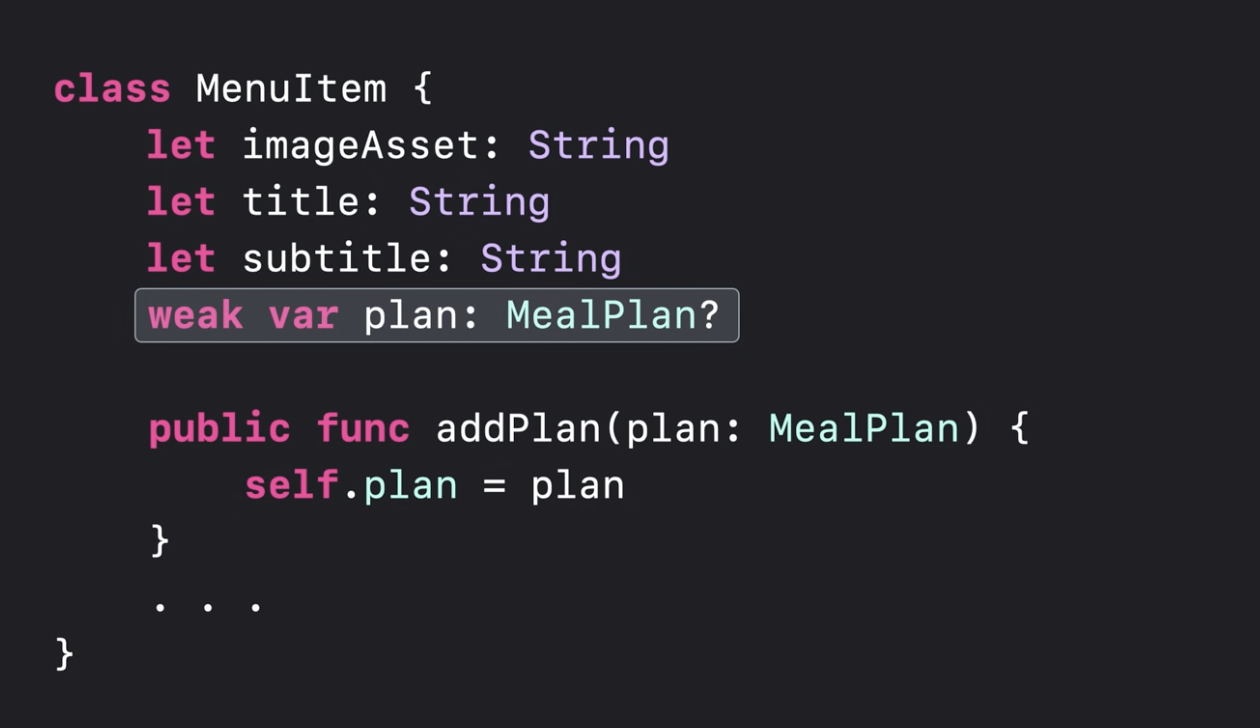
한쪽을 weak으로 바꿔주기
(뭔가 엄청난 가이드가 나올줄 알았는데 별건 아니었음...)
힙 공간에 이전보다 많은 메모리를 할당하는 이슈
실패한 XCTest로 돌아가서 살펴보자 어디를 봐야할지 확인하기 위해서 vmmap -summary 를 입력해봄. pre memgraph랑 post memgraph를 비교
vmmap -summary
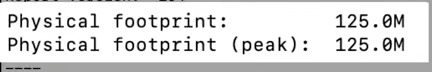
13 MB 차이가 남!
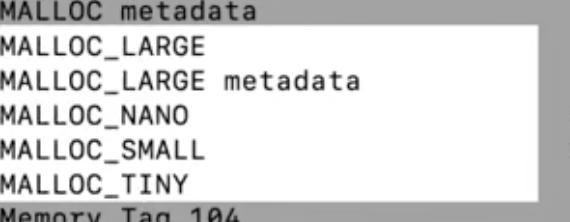
스크롤을 좀 더 내려봄. 프로세스의 메모리 사용이 region 별로 나눠져 있음
Heap allocation issue 라고 추정되기 떄문에 MALLOC_ region을 살펴보겠음
앞에 나왔던 설명 돌아보면 memory footprint = dirty memory + compressed memory 니까, 아래의 두 열을 보면됨. (compressed = swapped 같은 의미)
MALLOC_LARGE region에 대략 13 MB의 dirty memory가 있음 = 아주 강한 의심이 간다
어떤 object가 관여하는지 더 정확하게 파악해보자 heap -diffFrom 을 실행!
heap -diffFrom
post 에는 있지만 pre memgraph 에는 없는 것들이 출력됨 좀 내려보면 메모리를 object 단위로 나눠놓은게 있음. object의 개수, bytes 볼 수 있음
맨 위에 non-object가 13 MB 정도 차지하는 것을 볼 수 있음ㅠ Swift에서 주로 raw malloced bytes를 의미함 (뭐지...?)
non-object
non-object가 뭔지 파악하는 방법도 있음!! heap -address 명령어를 입력해서 분석. 최소 500kb의 non-object만 찾도록 지정
heap -address
유력한 용의자... 이 주소값을 가지고 다시 찾아보자
몇 가지 방법이 있음
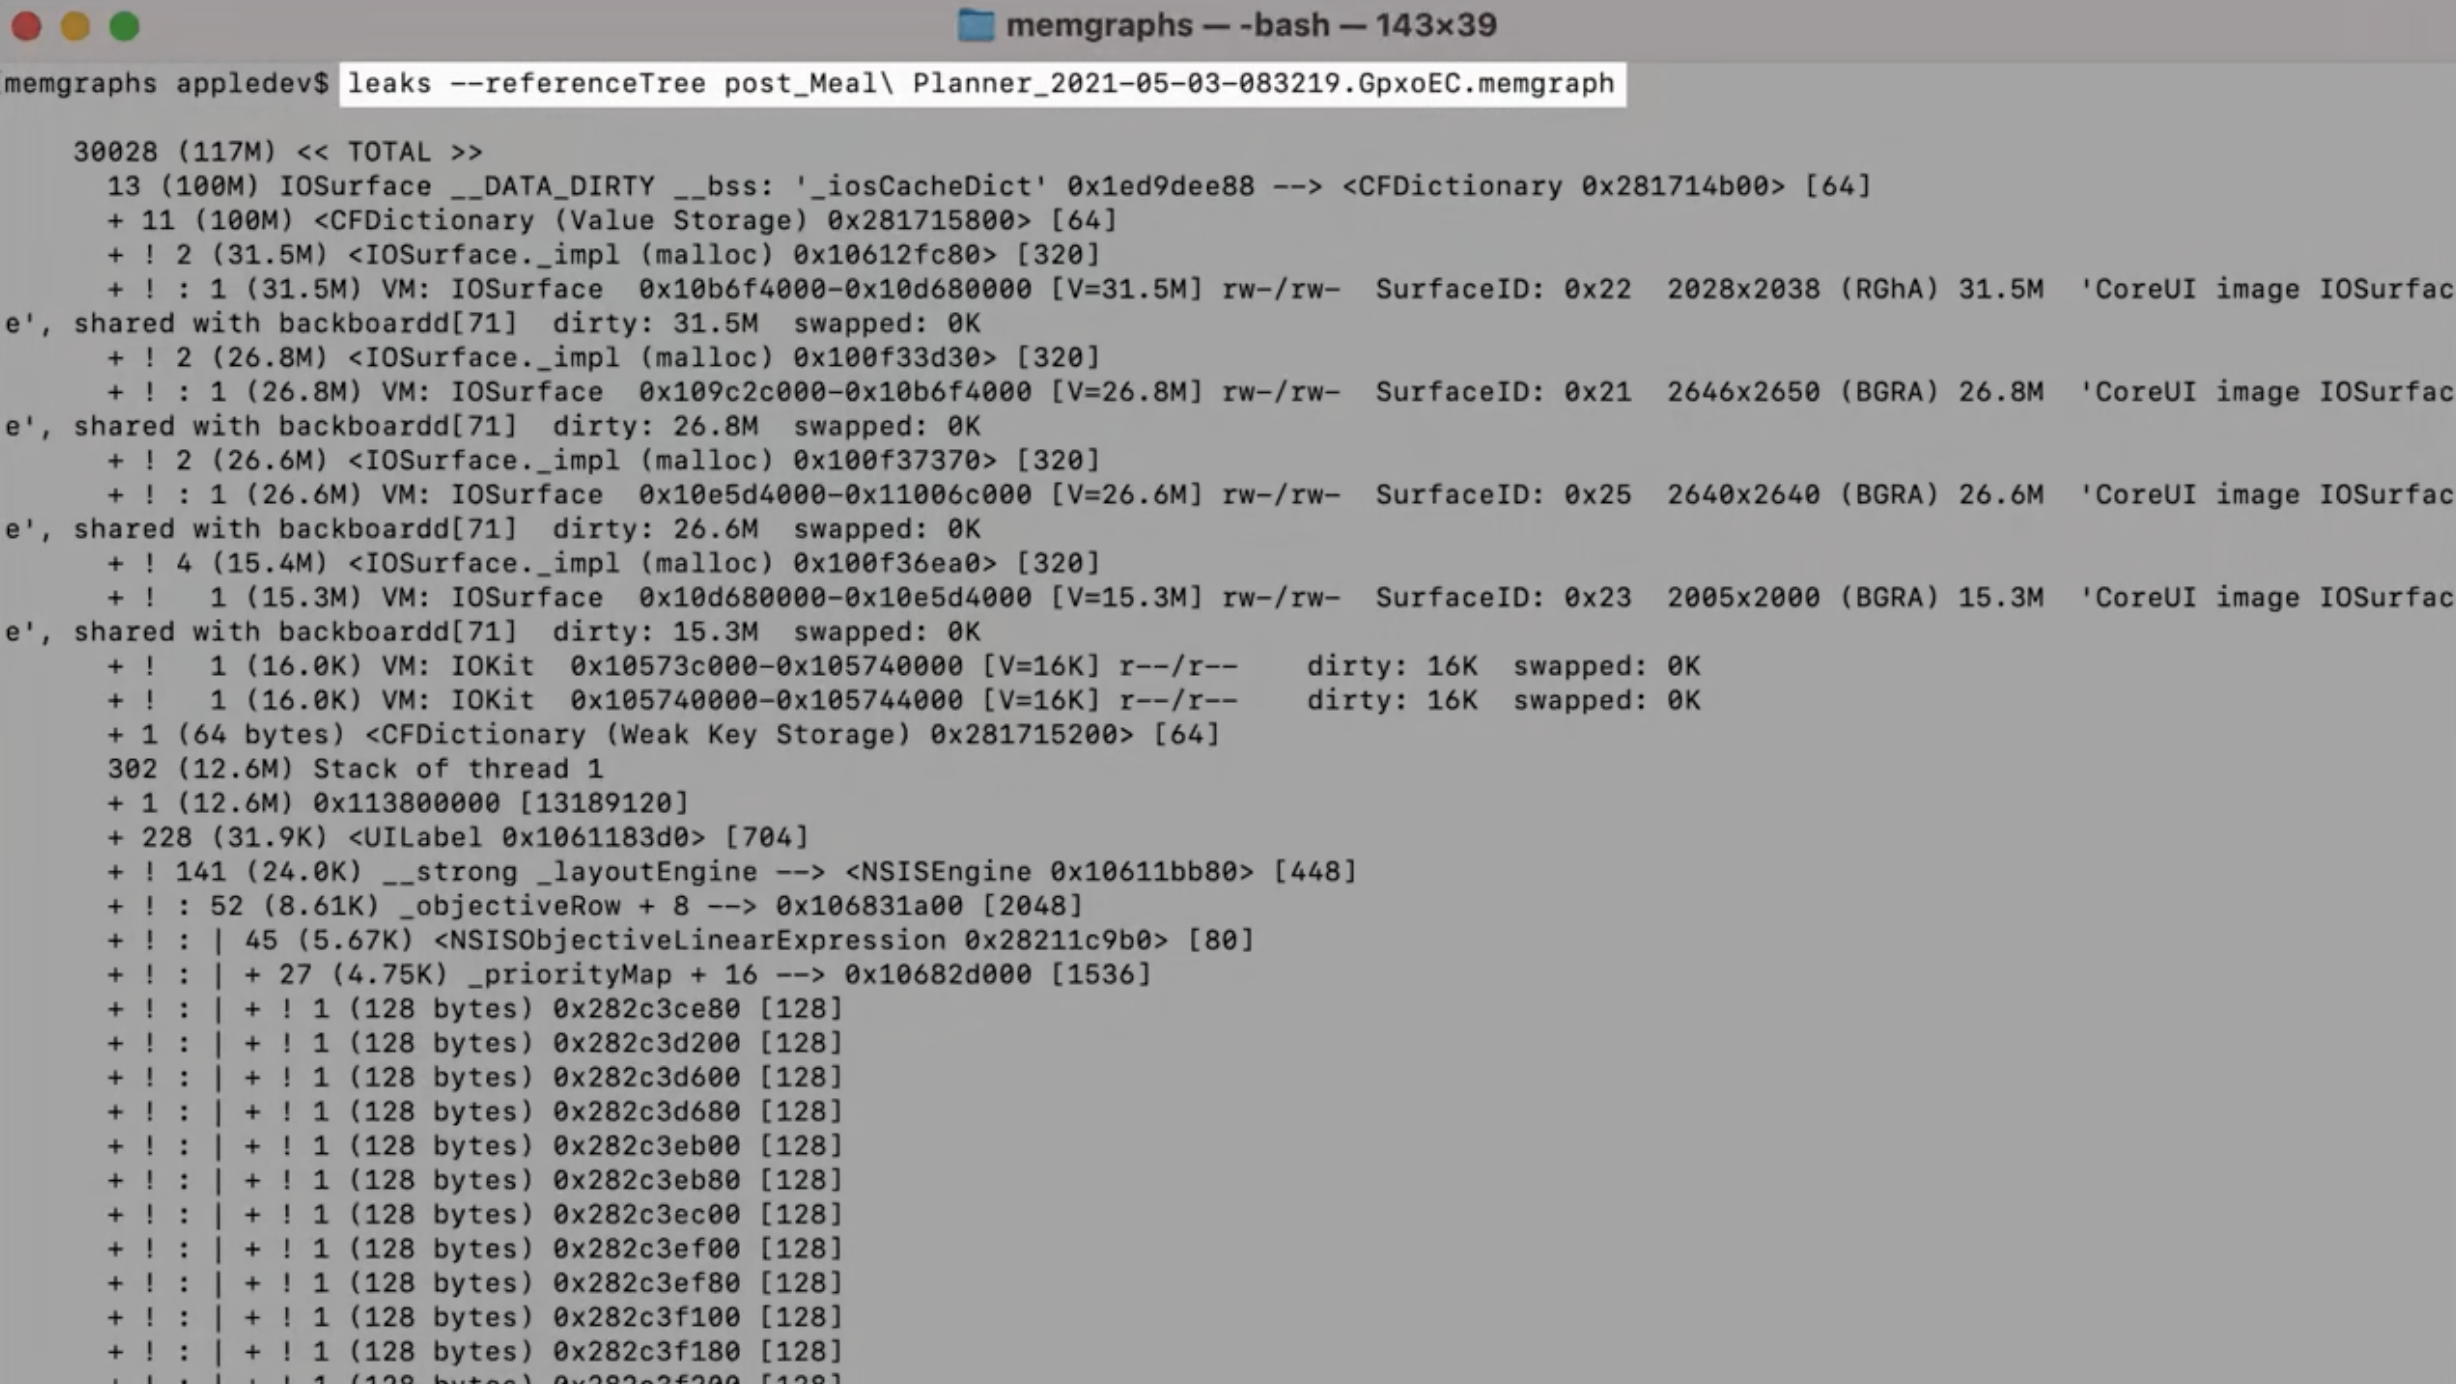
leaks --traceTree
특정 객체에 대한 정보는 없고 주소값만 있을 때 사용해 볼 수 있음
아마도 MKTCustomMeal PlannerCollectionViewCell 과 관련이 있어보임
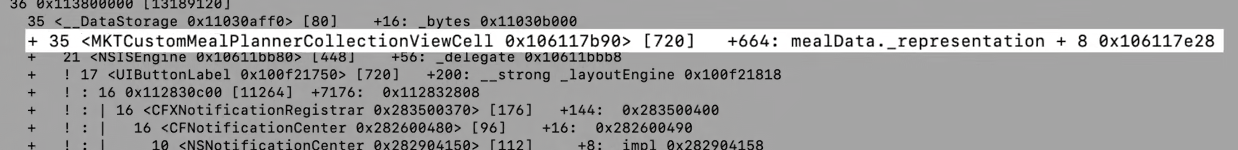
leaks --referenceTree
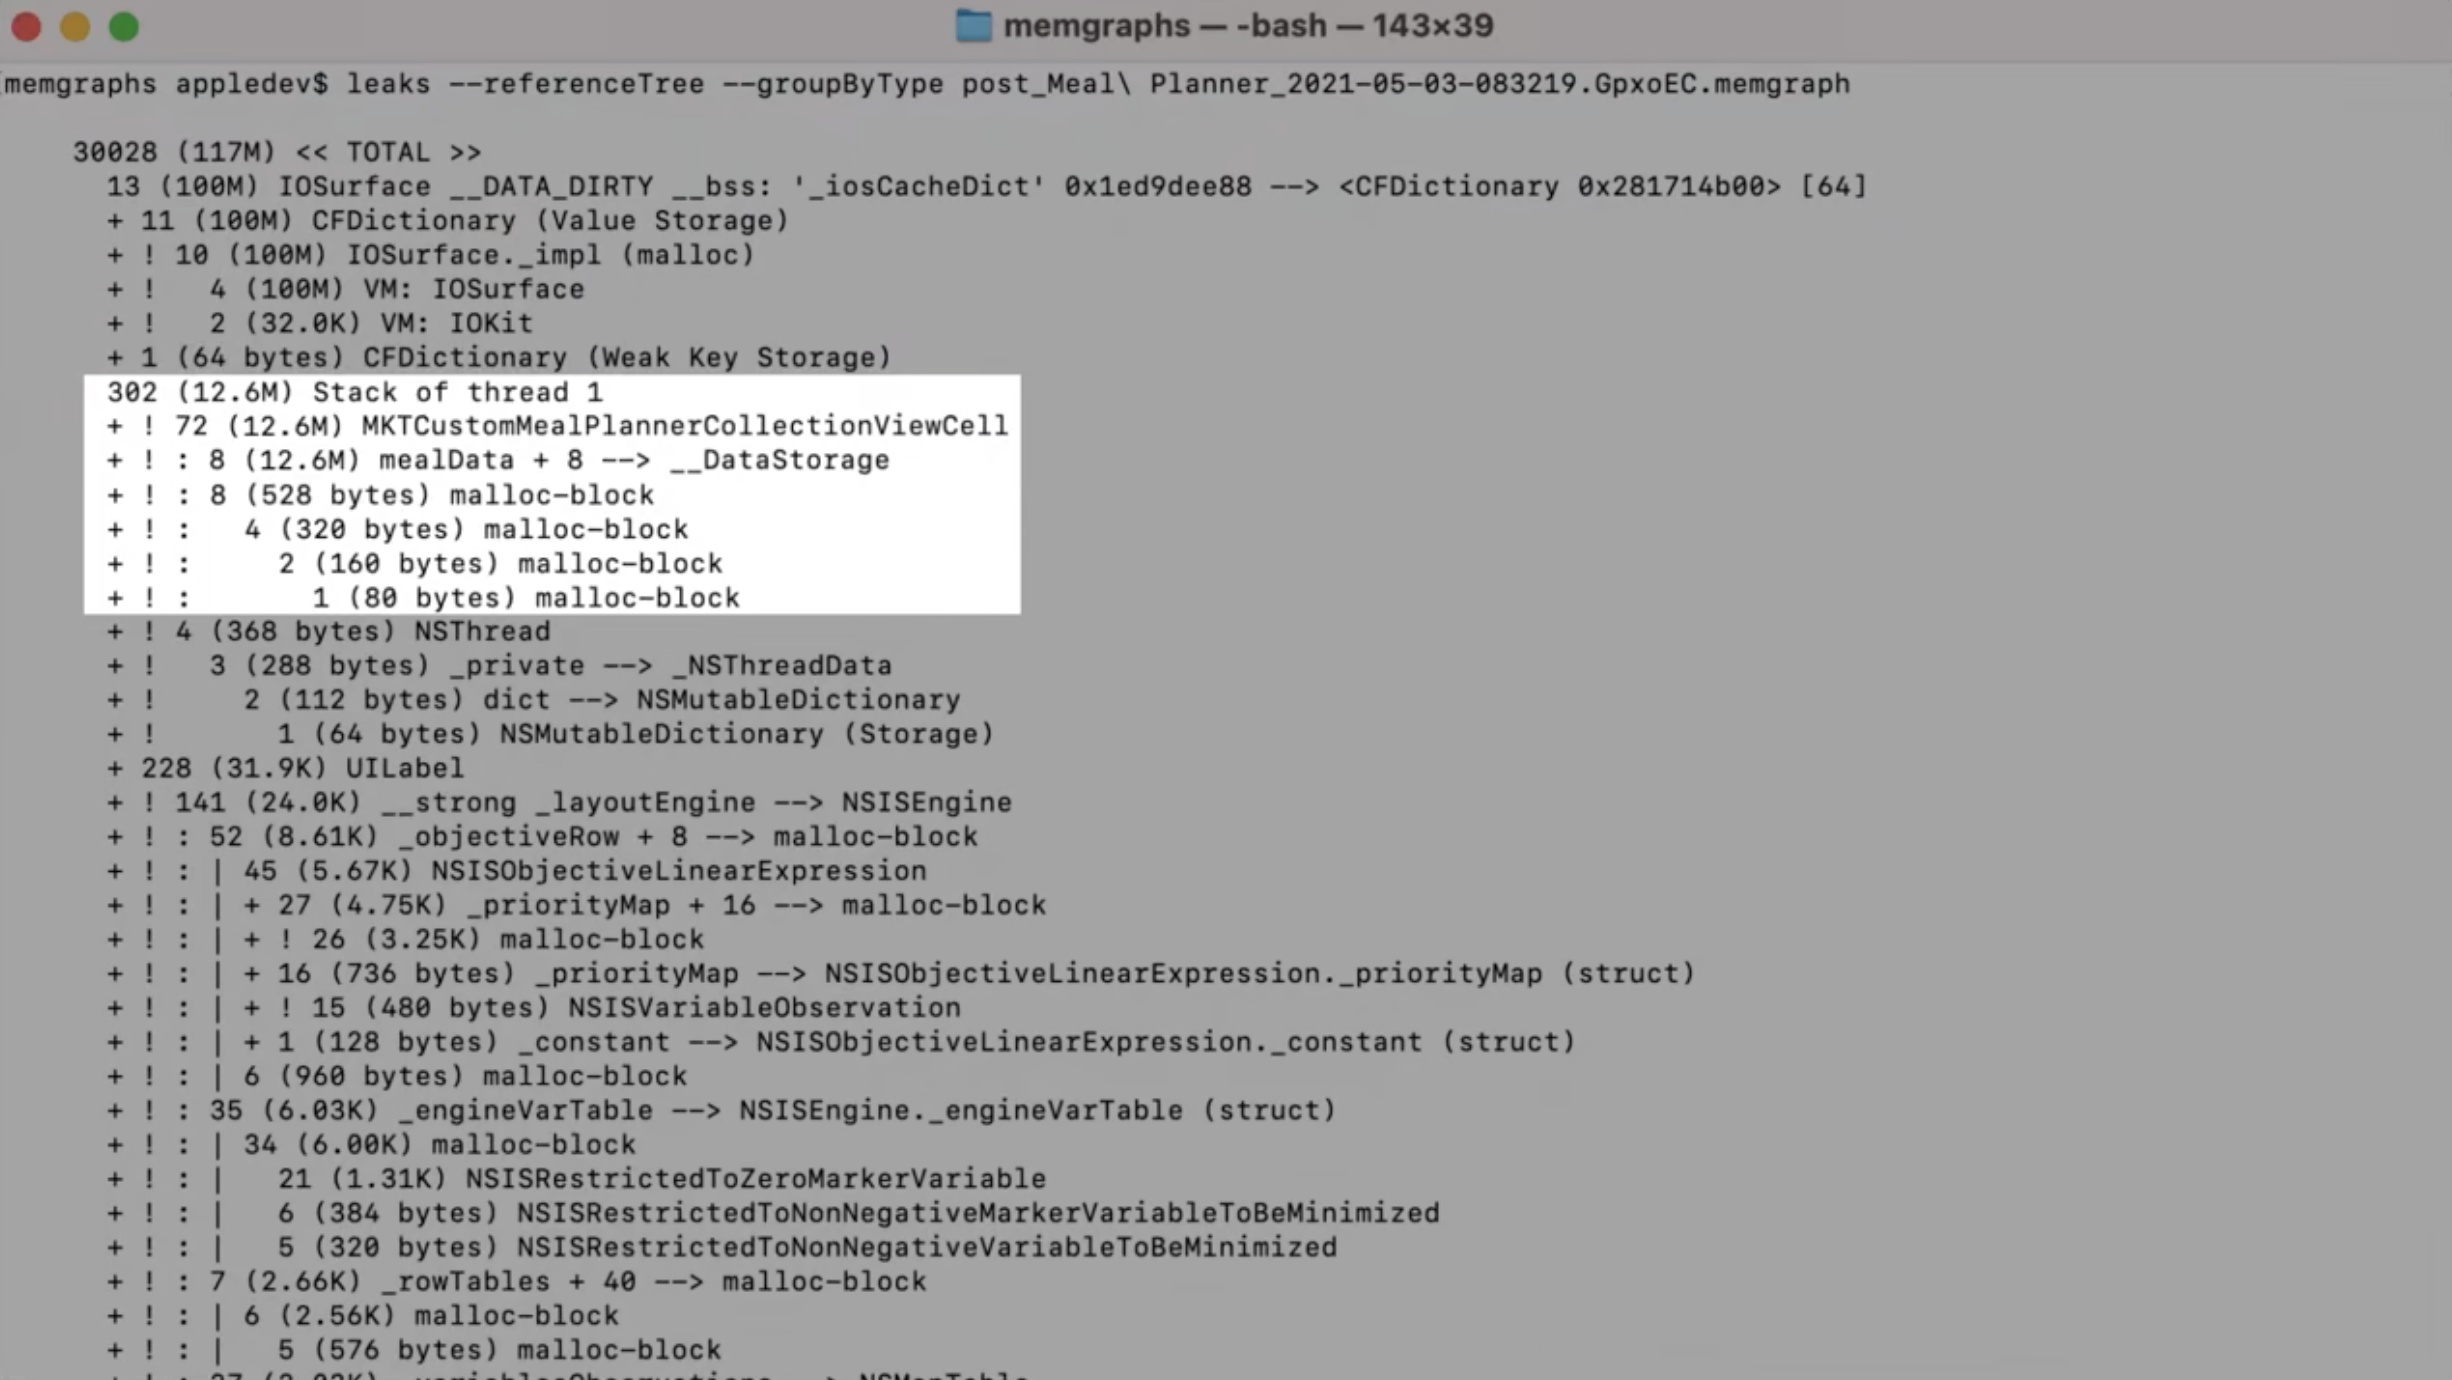
모든 메모리의 top-down reference를 보여줌
--groupByType 옵션 주면 좀 더 보기 편할 수 있음
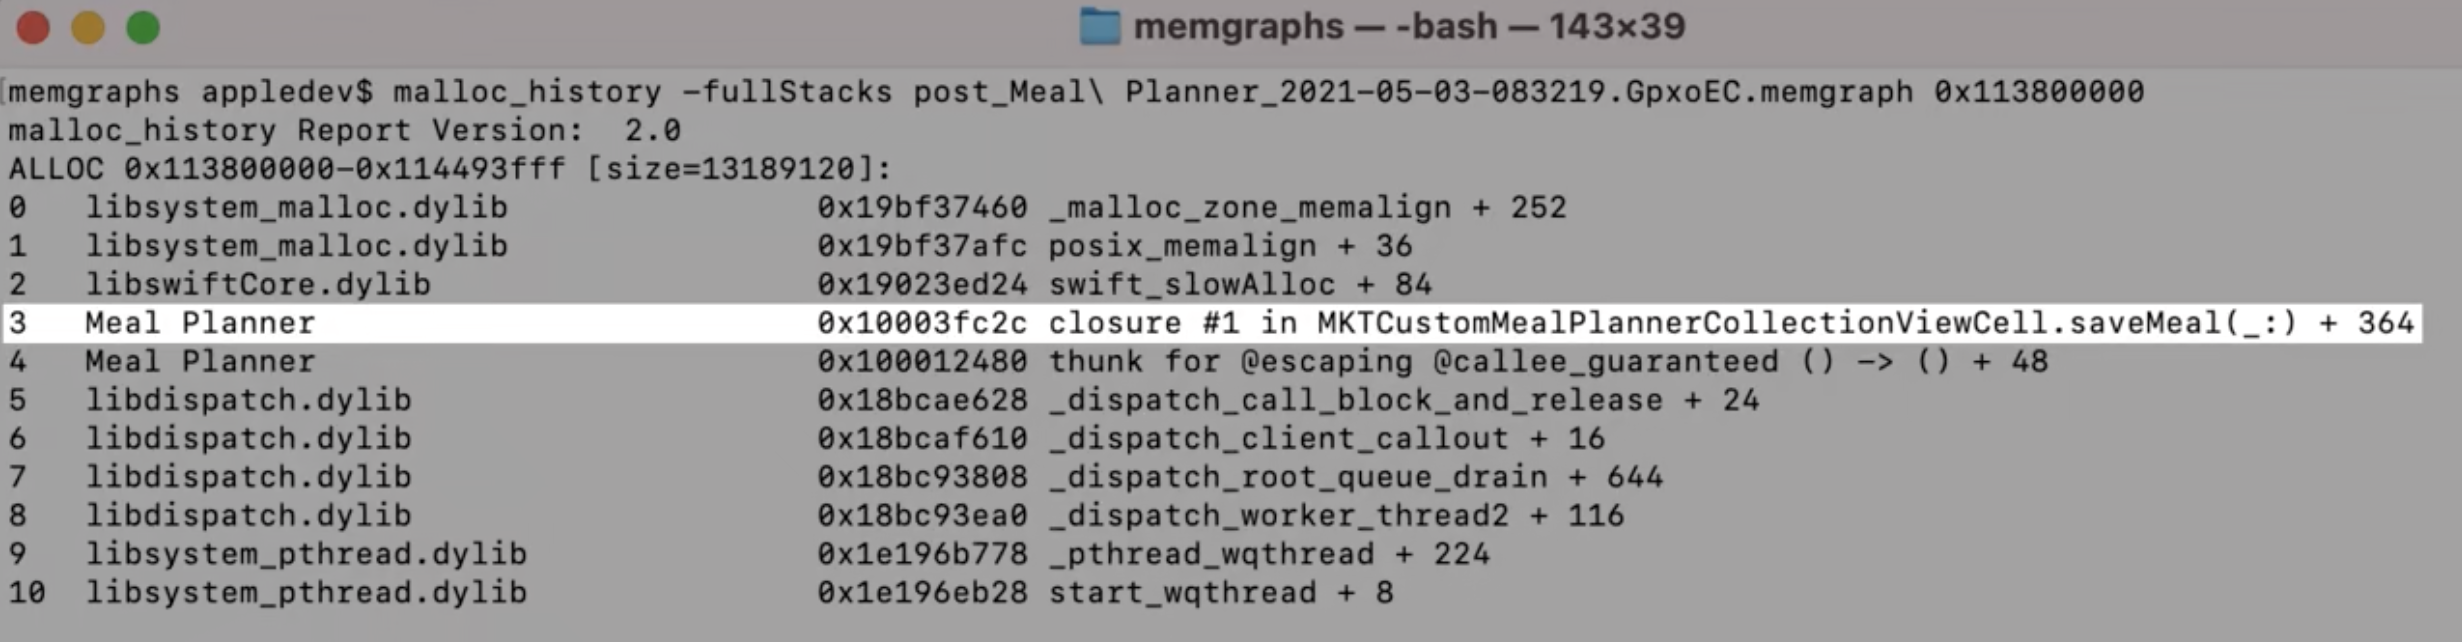
malloc_history -fullStacks
이 object가 어떻게 allocate되었는지 파악할 수 있음
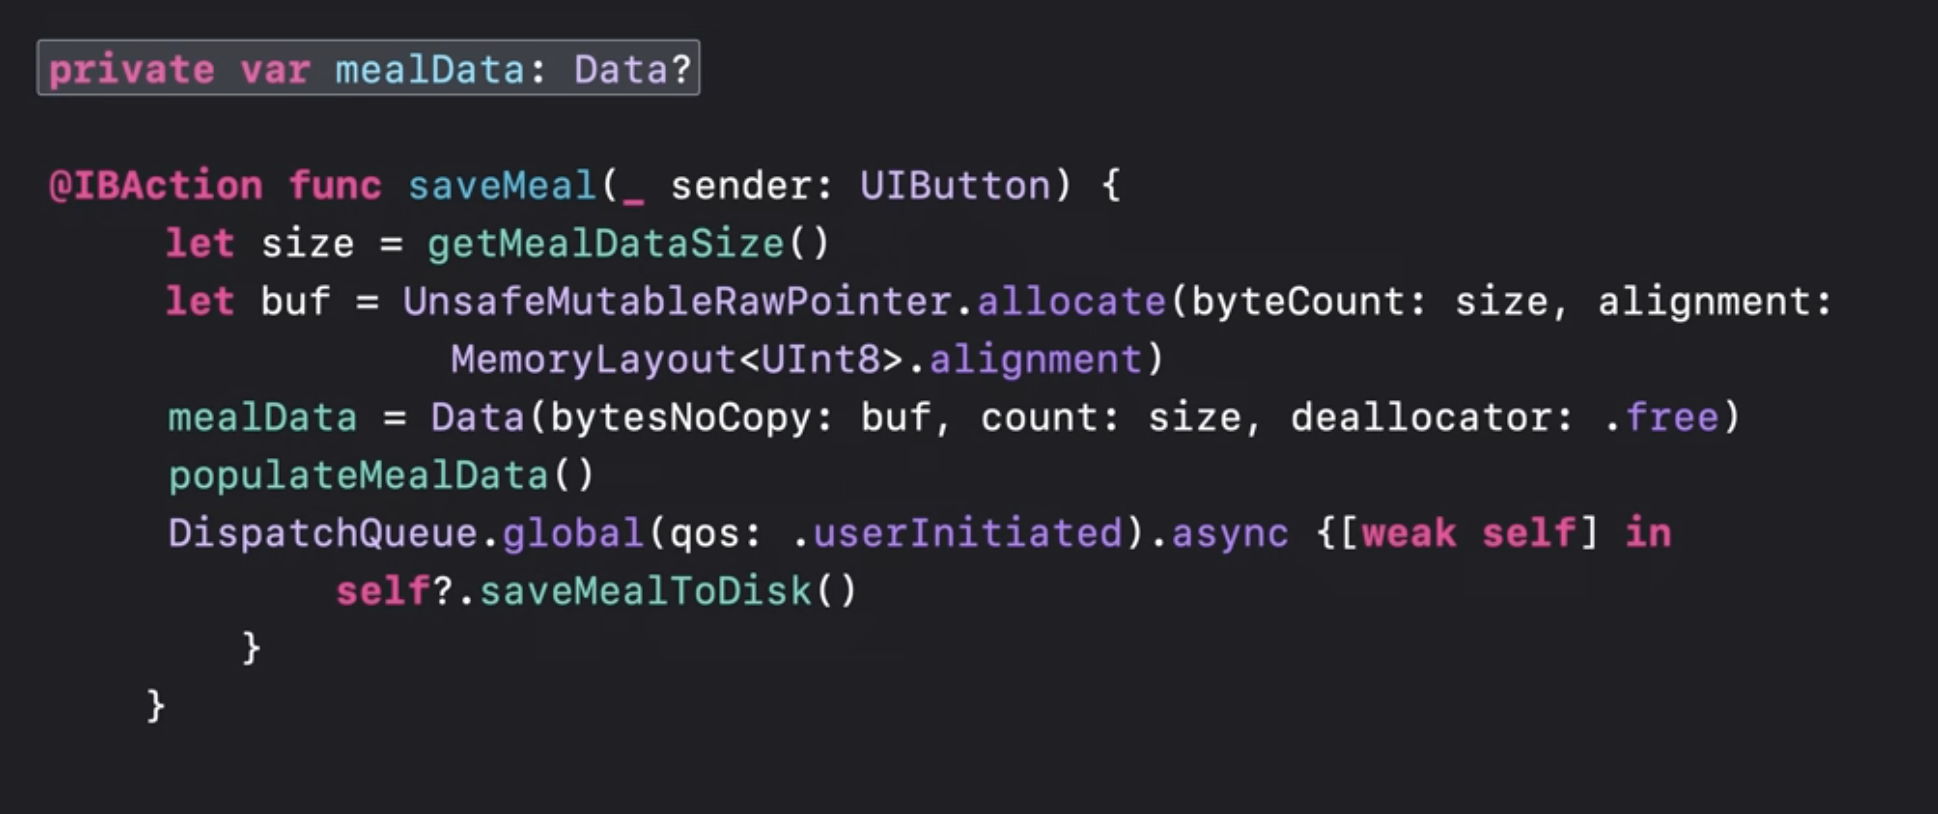
여기서 allocate 되었음을 파악할 수 있다
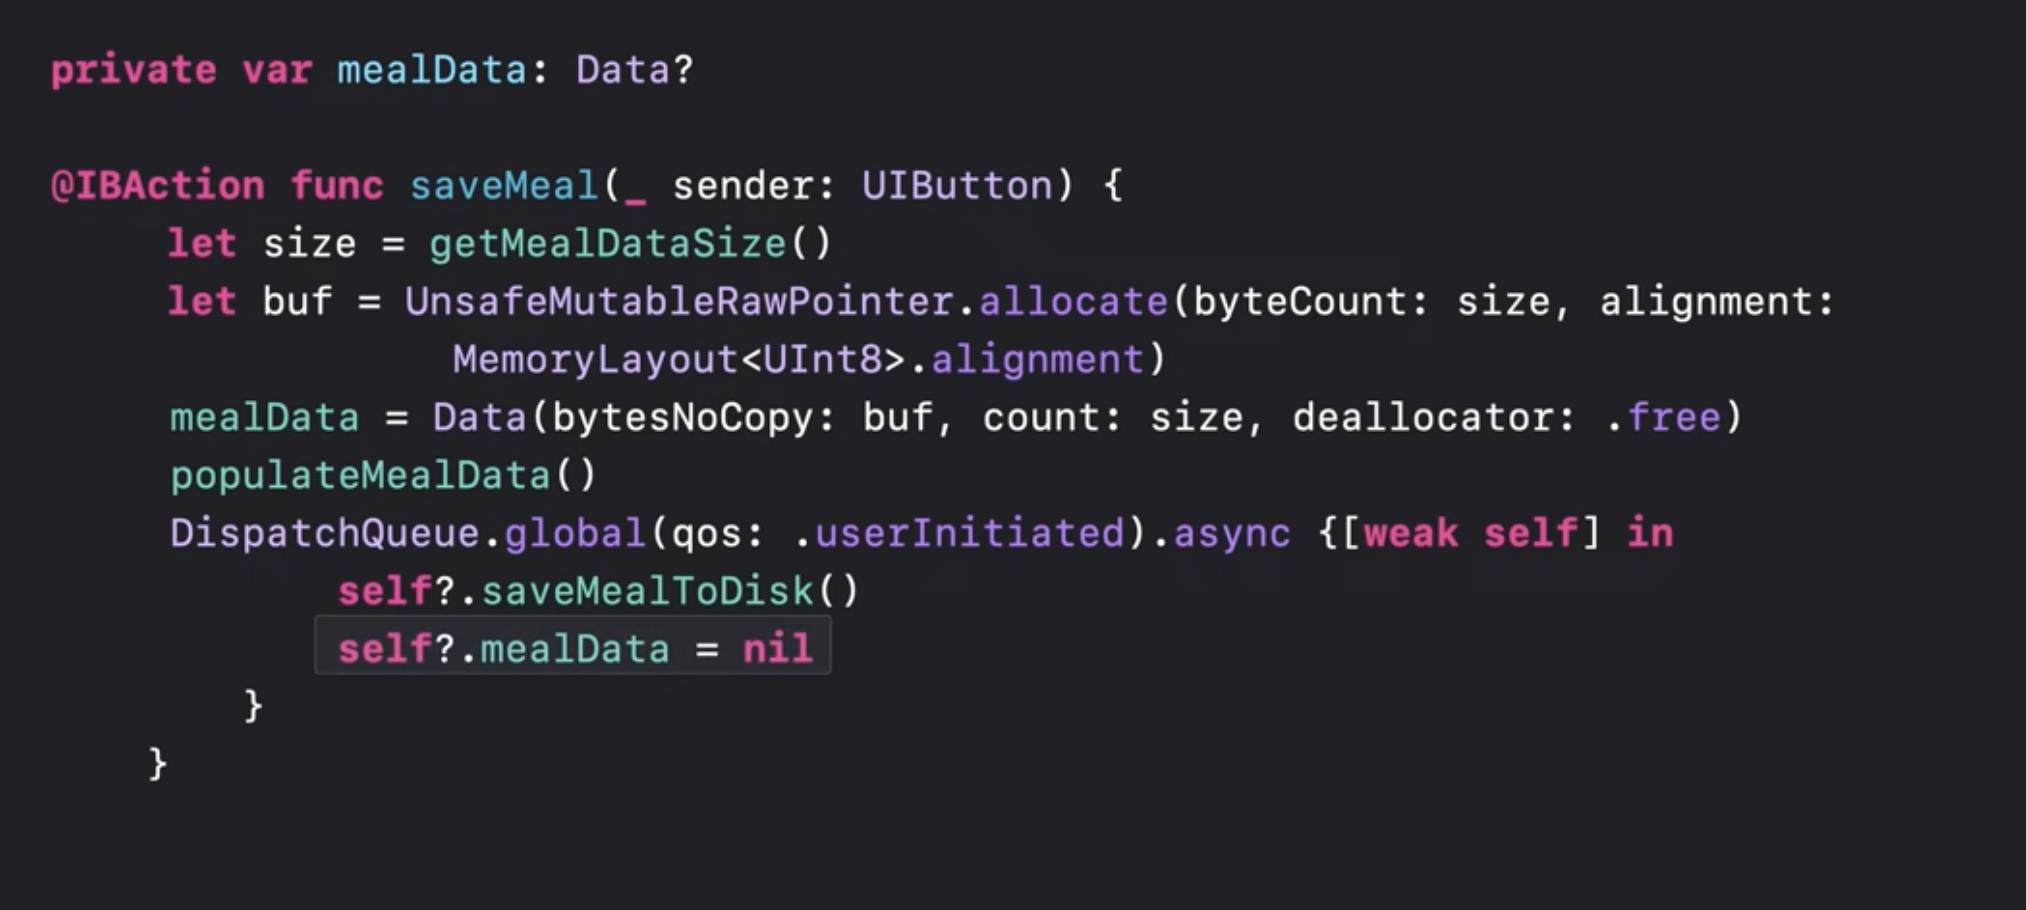
mealData는 saveMeal 되고나면 필요없는데 Cell이 유지되는 동안은 계속 남아있게 됨
saveMeal 이후에 mealData를 nil 처리 하는 방안이 있음
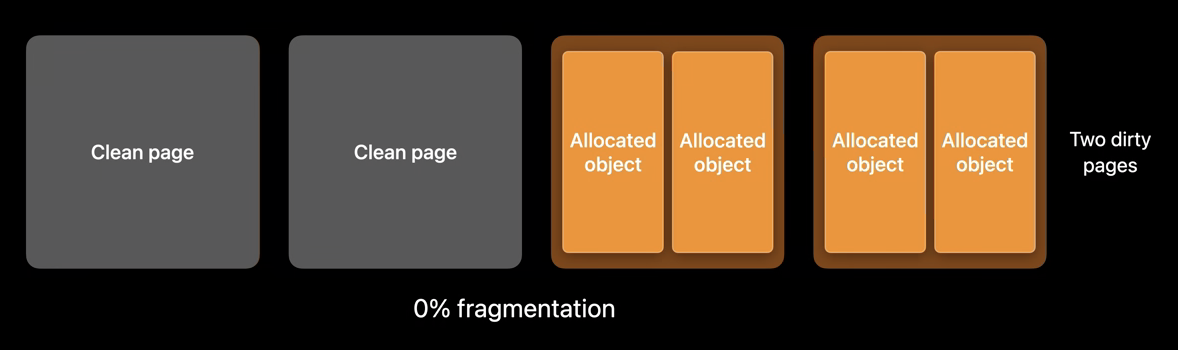
처음엔 Clean
프로세스가 작동하면서 Allocated object가 page를 채움
일부 Object가 deallocate 되면서 free memory가 됨. 하지만 여전히 allocated object가 있기 떄문에 여전히 dirty page.
시스템은 이 빈공간을 채우려고 함. 파란색 크기의 allocation이 있다고 가정함. 빈공간을 합쳐보면 파란색 allocation을 받아줄 수 있지만, 한번에 allocate할 공간은 없음
기존의 슬롯을 활용할 수 없기 때문에, 새로운 dirty page를 사용하게 되었음. 이렇게 free memory가 부분적으로 남아있는 경우를 Fragmentation 이라고 함
fragmentation을 줄이기 위해서는 메모리에서 유사한 lifetime을 가진 object끼리 allocate 하는 것이 가장 좋은 방법
동일한 Object는 모아서 allocate
이러면 Object가 deallocate 되었을 때 Clean Page를 확보할 수 있음
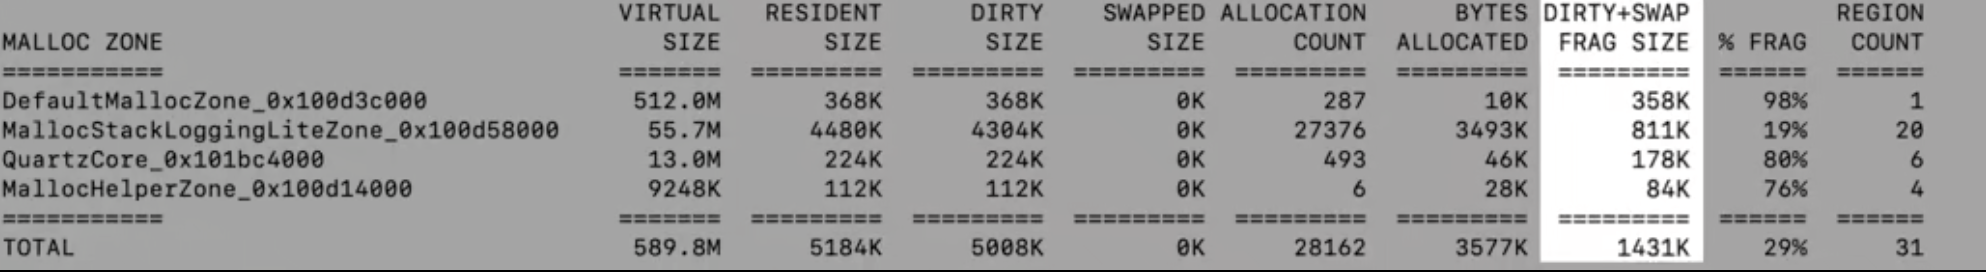
vmmap -summary 입력해서 볼 수 있음
DIRTY+SWAP FRAG SIZE를 보면 정확히 낭비되는 공간을 볼 수 있음
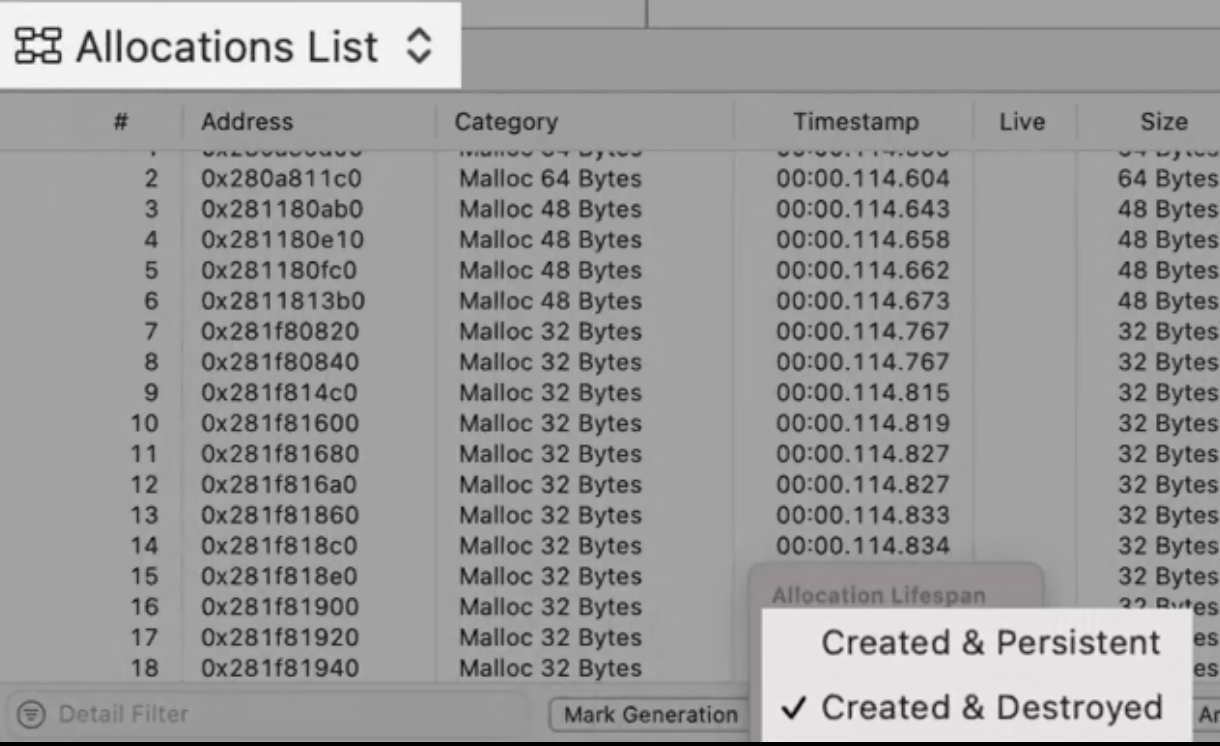
Instruments Tool > Allocations
Allocation List, Created & Destroyed를 체크해서 확인
Instruments tool 사용을 좀 더 알아보려면 -> Getting Started with Instruments
새 기능 추가 후에도 XCTest를 작성하여 지속적으로 퍼포먼스를 모니터링 할 수 있음
The text was updated successfully, but these errors were encountered:
cozzin
No branches or pull requests

https://developer.apple.com/videos/play/wwdc2021/10180/
1. Impact of memory footprint
1-1. 왜 memory footprint를 신경써야하나?
사용자 경험을 극대화하기 위해서!
1-2. Memory footprint
근데 이건 도대체 뭘까?! Dirty + Compressed memory!!
더 알아보기: iOS Memory Deep Dive - https://developer.apple.com/wwdc18/416
2. Tools for profiling memory
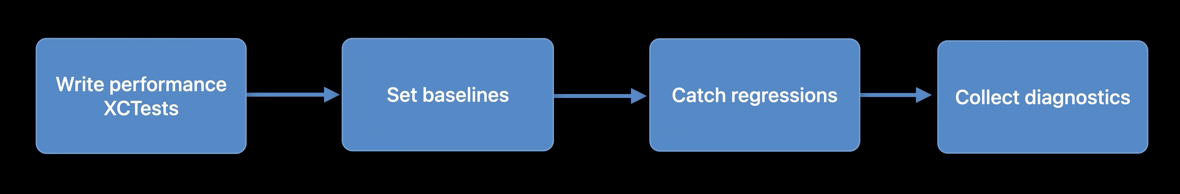
🟢 2-1. Performance XCTests
결과 확인
그러고 나면 테스트 옆에 회색 다이아몬드를 눌러서 결과를 확인할 수 있음
Metric 고르기
각 iteration 당 측정된 결과 확인
Baseline 지정
평균 값을 baseline으로 지정할 수 있음 -> 다음 테스트와 비교할 수 있음
테스트 실패
baseline 보다 높게 나올 경우 테스트 페일됨. 이 지표는 언제 멈추고 코드를 수정해야할지 알려줌.
baseline 부터의 편차를 regression 이라고 부름.
Diagnostic collection in XCTests (Xcode 13 신기능 👀)
앞서 나온 regression 분석을 위한 새로운 도구가 나왔음
Ktrace files, Memory graphs.
Ktrace files: 일반적인 시스템 조사, 렌더링 파이프라인 파악, 메인 쓰레드 행 걸리는 이유 분석 등 다양하게 쓸 수 있음
더 알아보기
🕸 2-2. Memory Graph
Visual debugger로 볼 수도 있지만 command line 으로도 확인할 수 있음
Enable diagnostic collection
아직 뭔지 잘 모르겠음...ㅠ command line 에서 이렇게 활성화 시킬 수 있음.
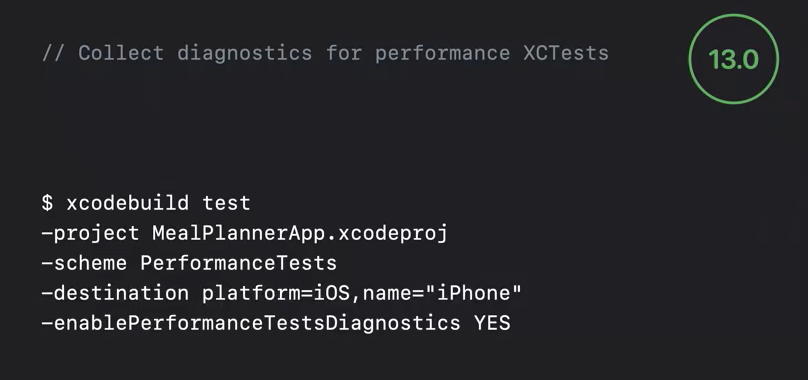
이렇게 해두면 nonmemroy metric에 대한 ktrace collection과 memory metrc에 대한 memgrph를 사용할 수 있다.
테스트 결과
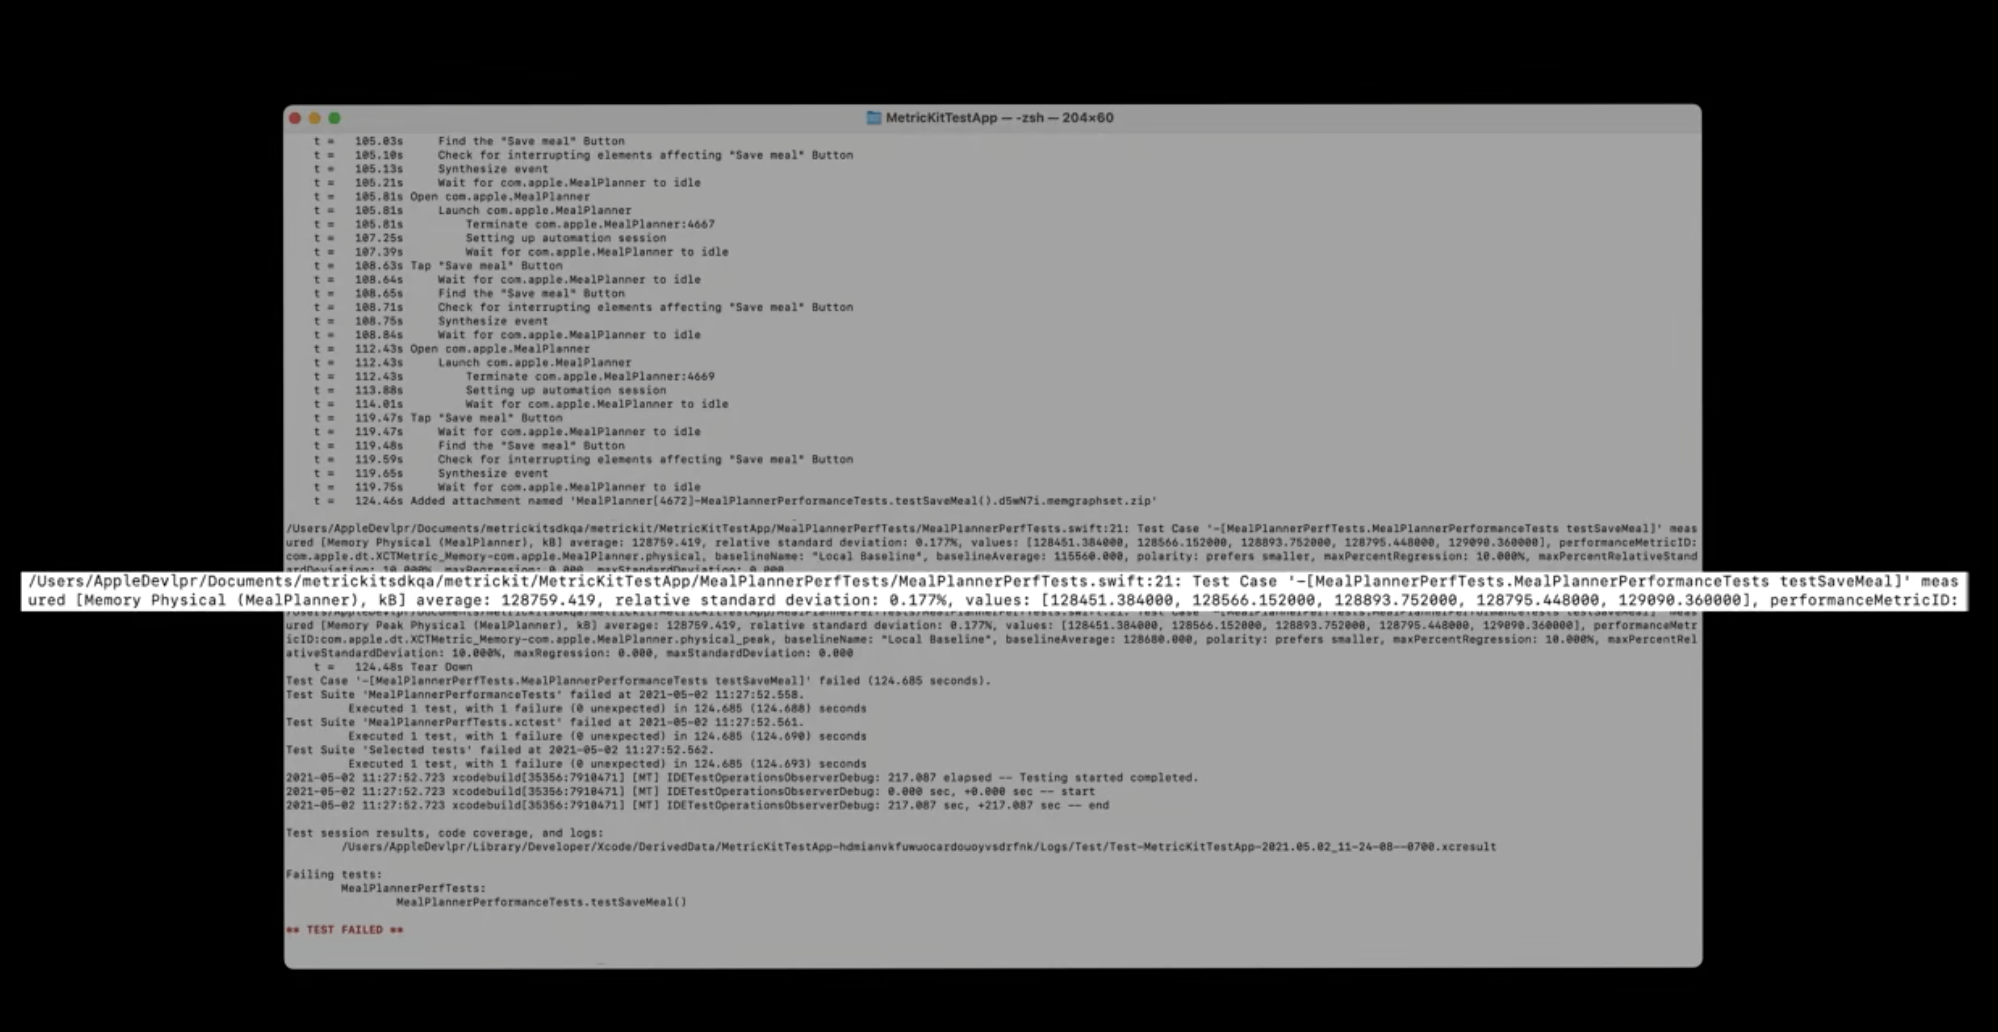
콘솔에 출력는게 많은데 그 중에 주목할 것들은...
테스트 통과 여부
테스트 실패 이유
예제에서는 퍼포먼스 baseline 기준을 넘지 못했음
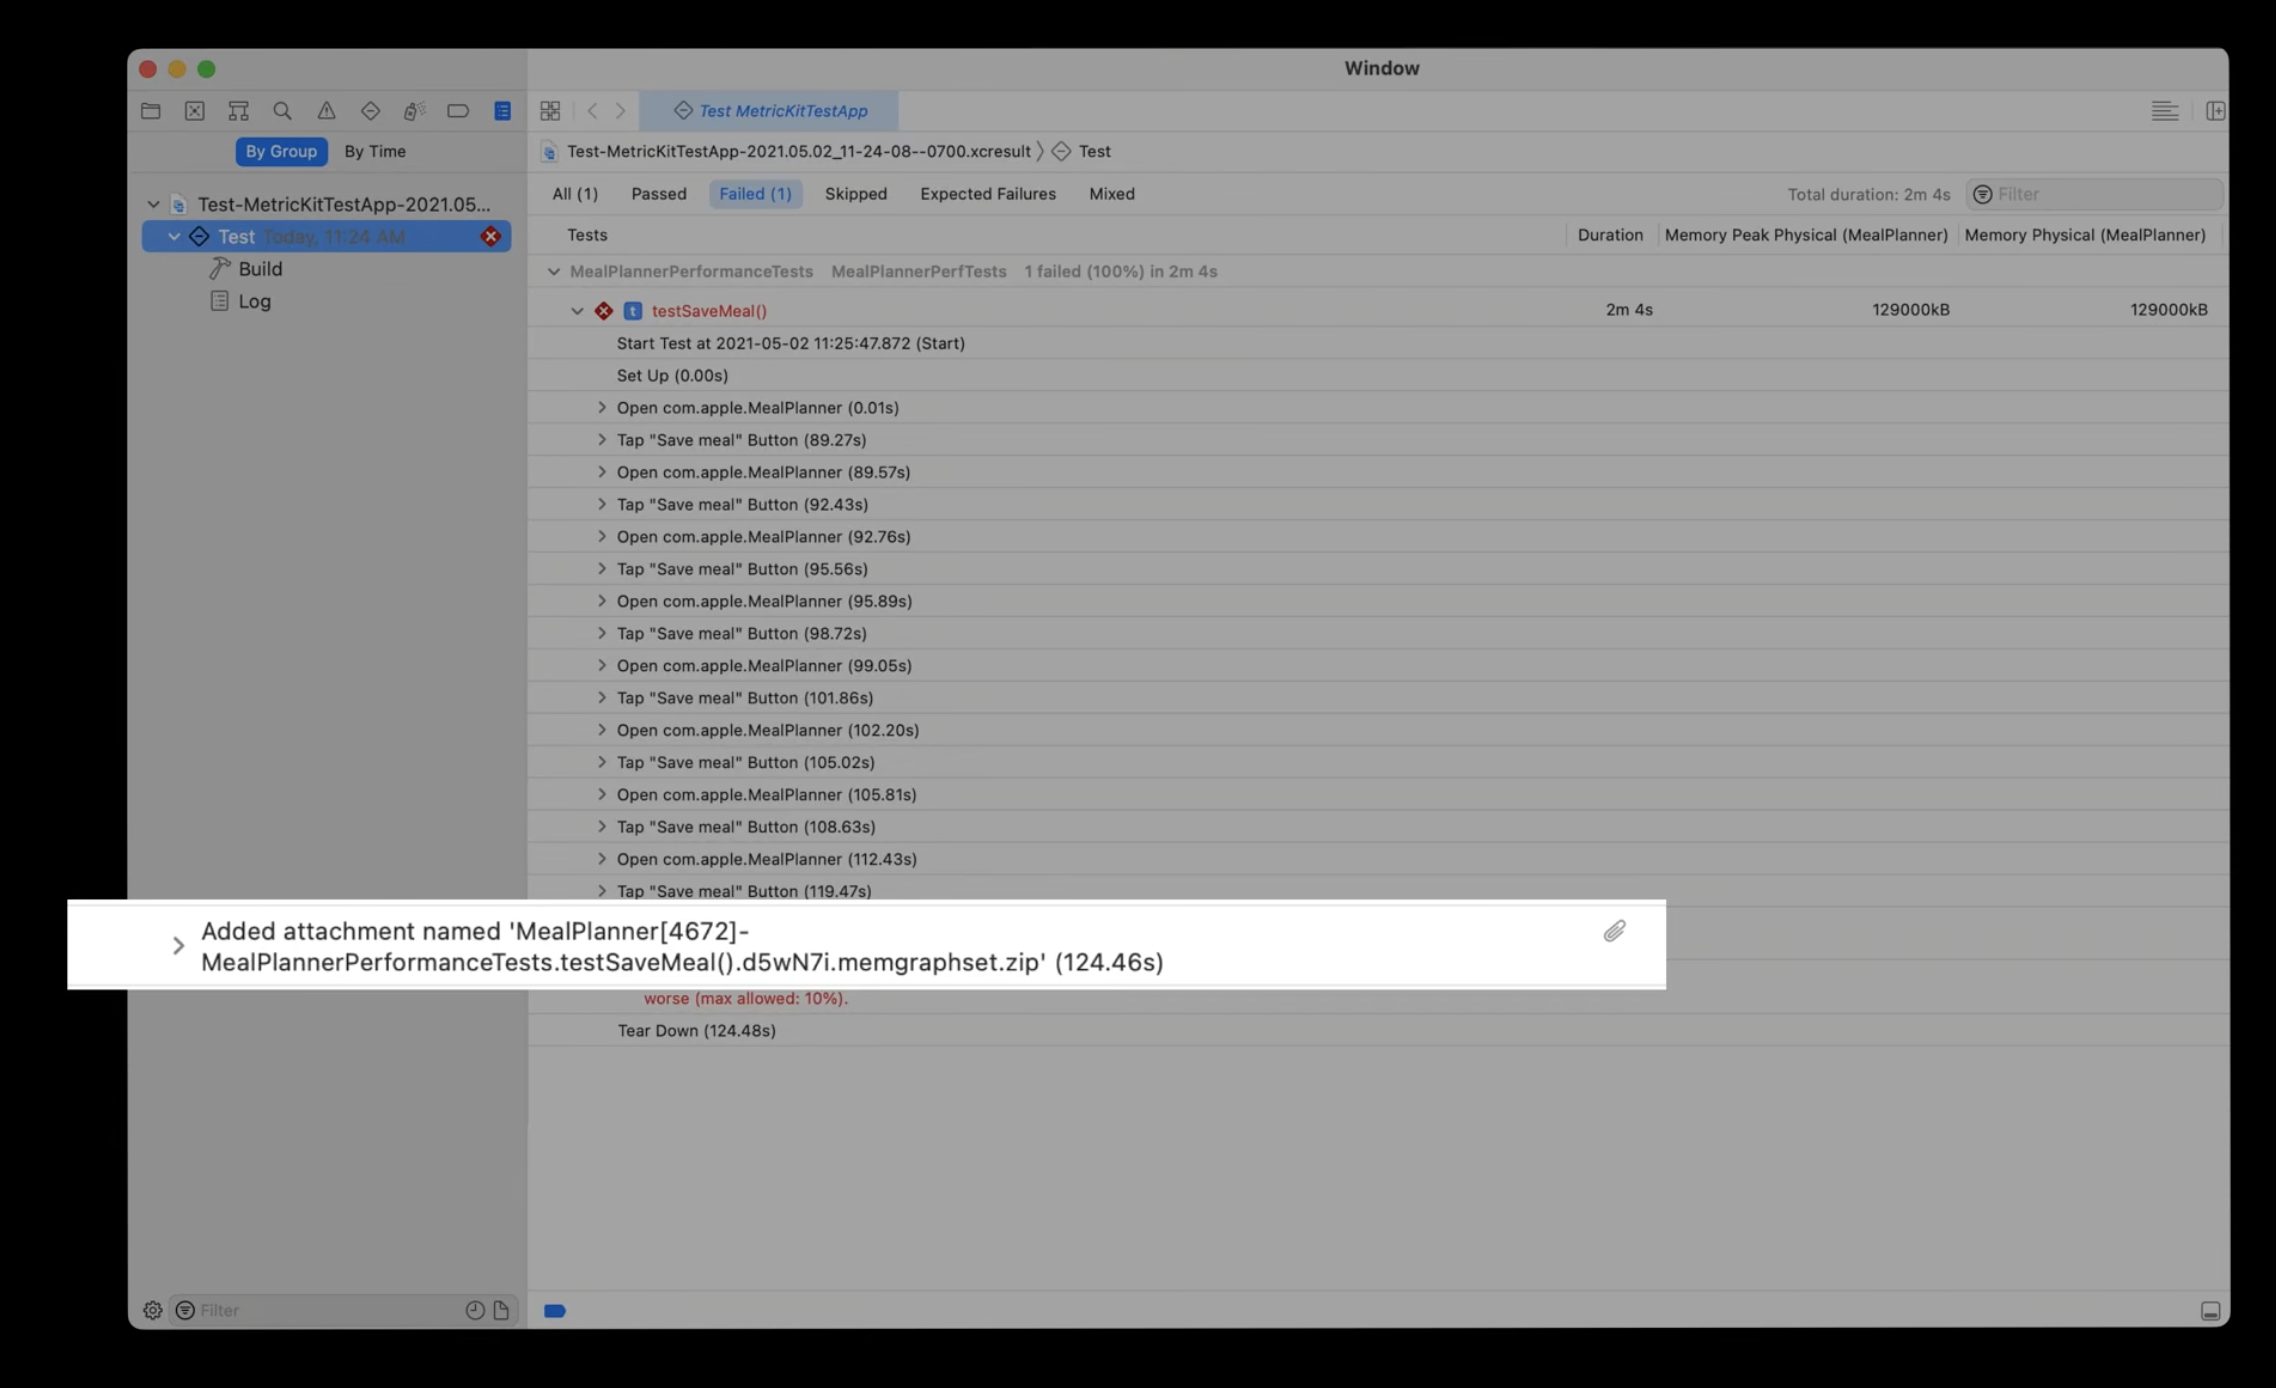
xcresult 파일
xcresult 열어보기
첨부된 memgraph가 있음!
zip 파일 열어보면
3. Types of memory issues
자 이렇게 추출한 파일을 보고 메모리 이슈를 분석해봅시다
Leak, Heap size issue 이슈를 살펴봄
Command line tool로 메모리 분석하는 거 더 찾아보려면...
iOS Memory Deep Dive - https://developer.apple.com/wwdc18/416
3-1. Leaks
객체를 allocate 하고 deallocate 하지 않은 채로 모든 reference를 잃어버리면 발생함
Leak 발생 원리
Retain cycle
memgraph 파일로 이슈 살펴보기
몇개의 leak이 발생했는지 분석해줌. 아래에는 좀 더 자세한 callstack이 나와있음
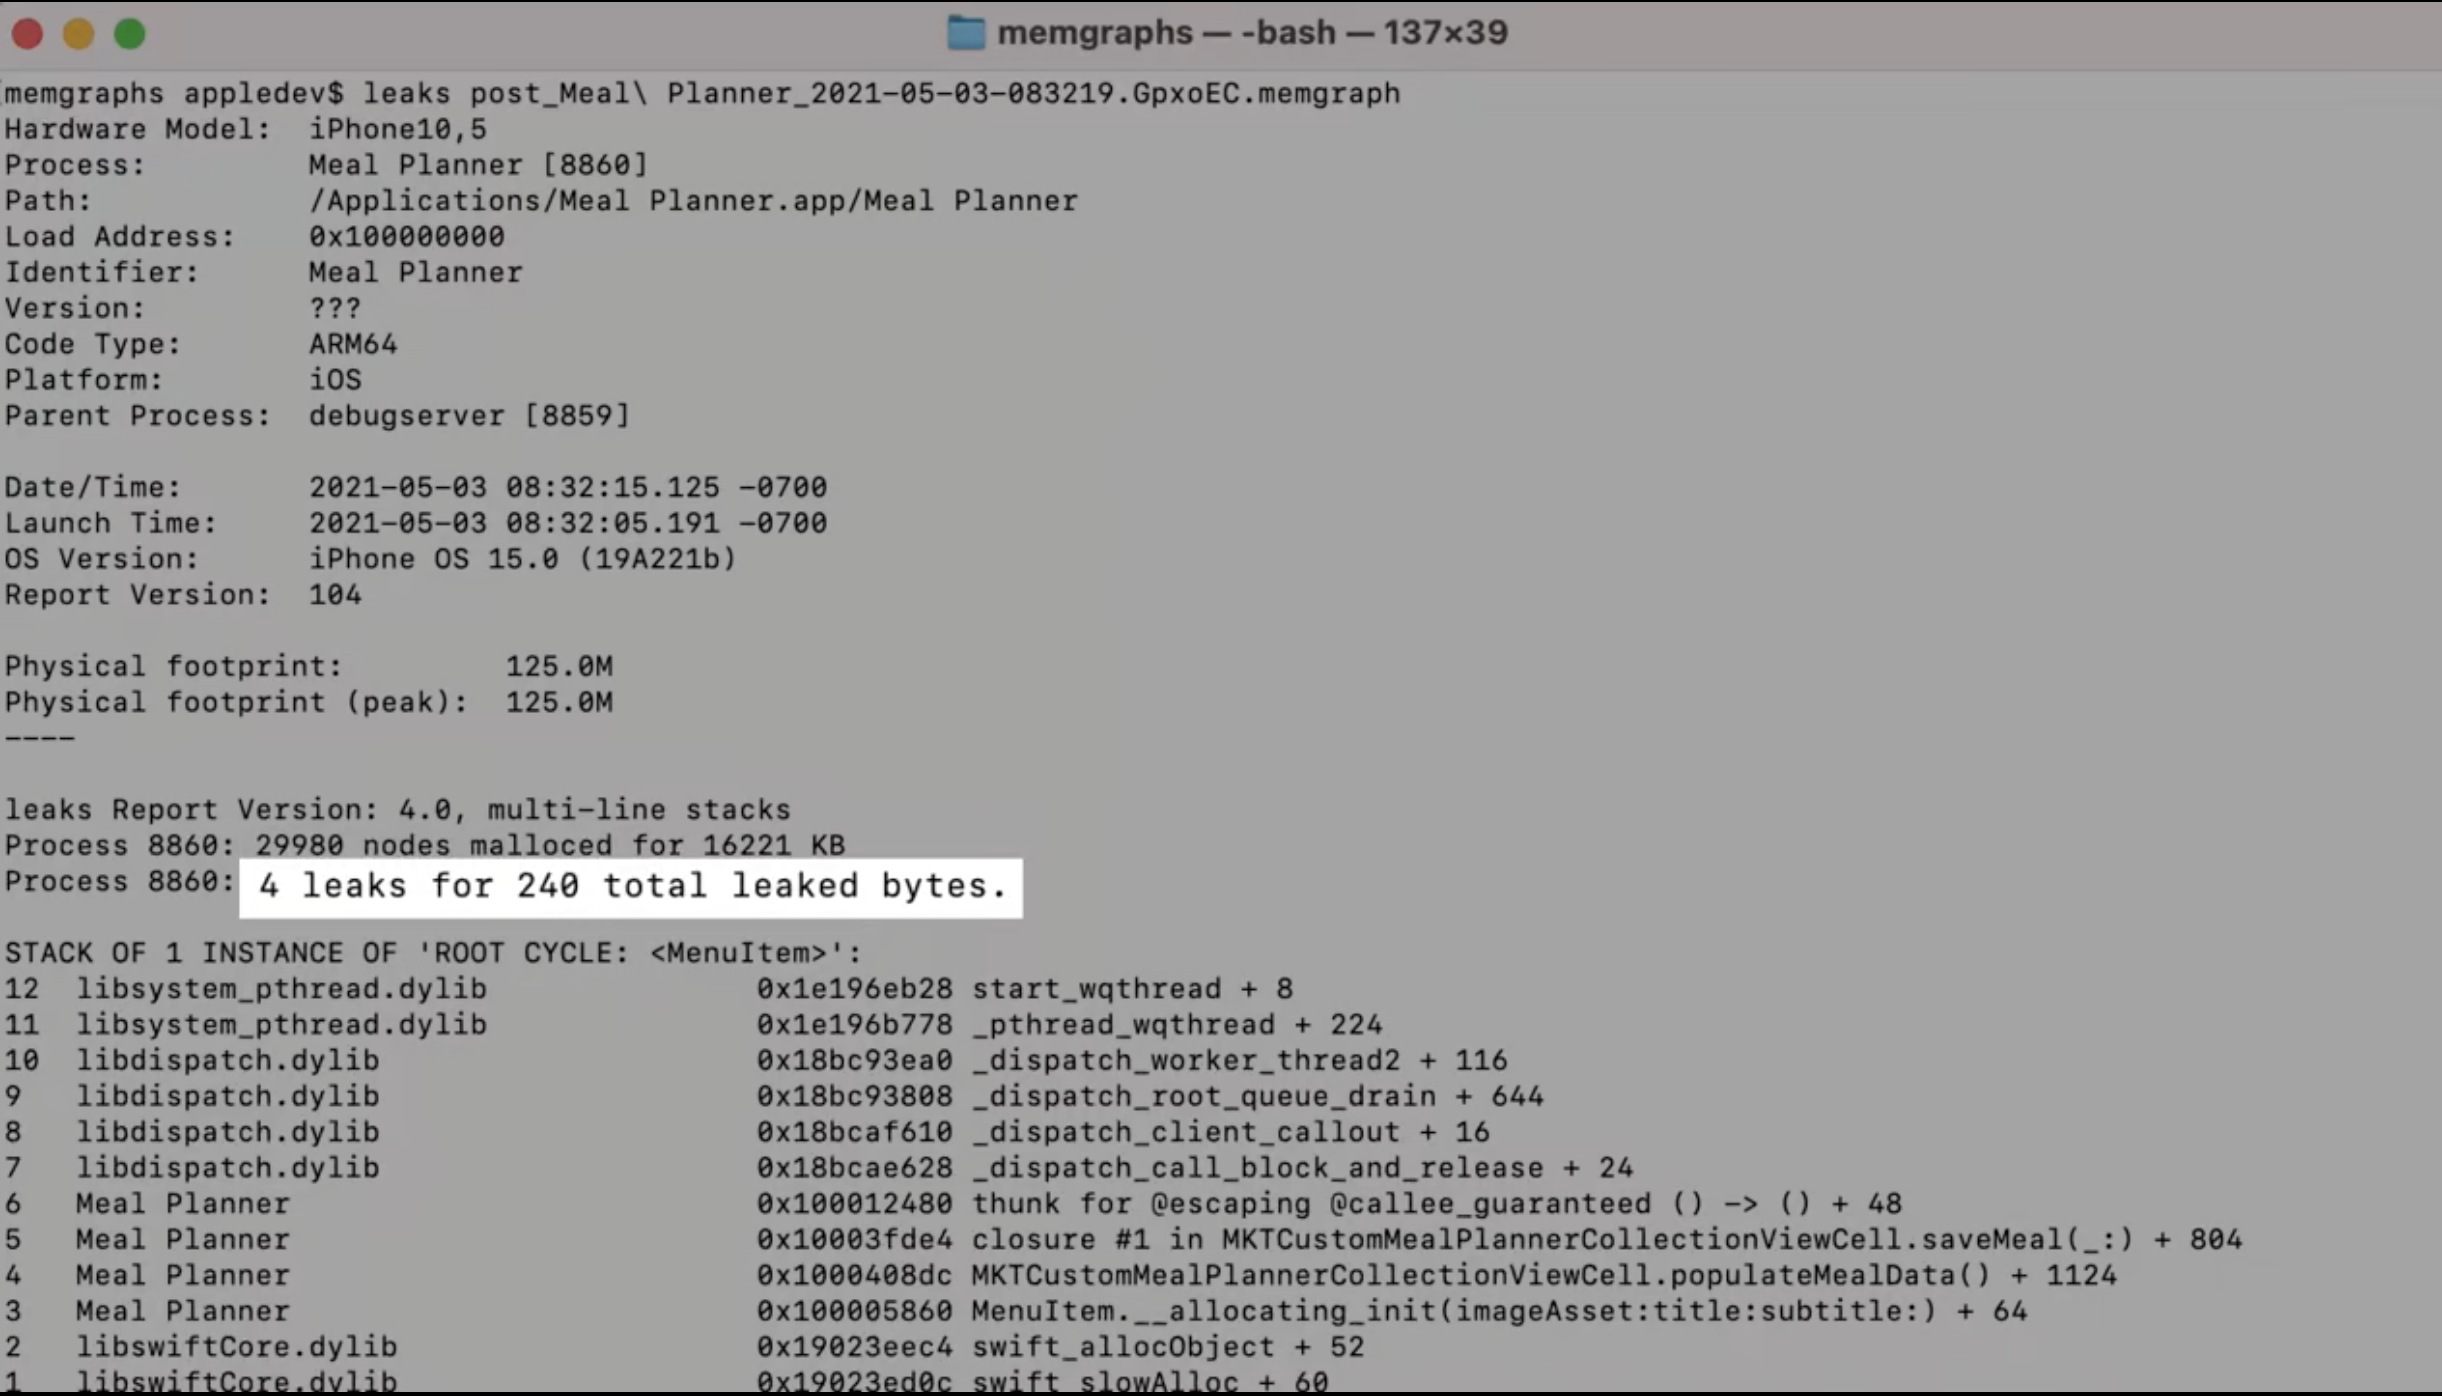
우리 앱에 있는 심볼을 발견할 때가 있음

코드를 들어가보면 서로 참조 하고 있음 :)
한쪽을 weak으로 바꿔주기
(뭔가 엄청난 가이드가 나올줄 알았는데 별건 아니었음...)
3-2. Heap size issues: Heap allocation regressions
힙 공간에 이전보다 많은 메모리를 할당하는 이슈
실패한 XCTest로 돌아가서 살펴보자
어디를 봐야할지 확인하기 위해서
vmmap -summary를 입력해봄.pre memgraph랑 post memgraph를 비교
13 MB 차이가 남!

스크롤을 좀 더 내려봄.
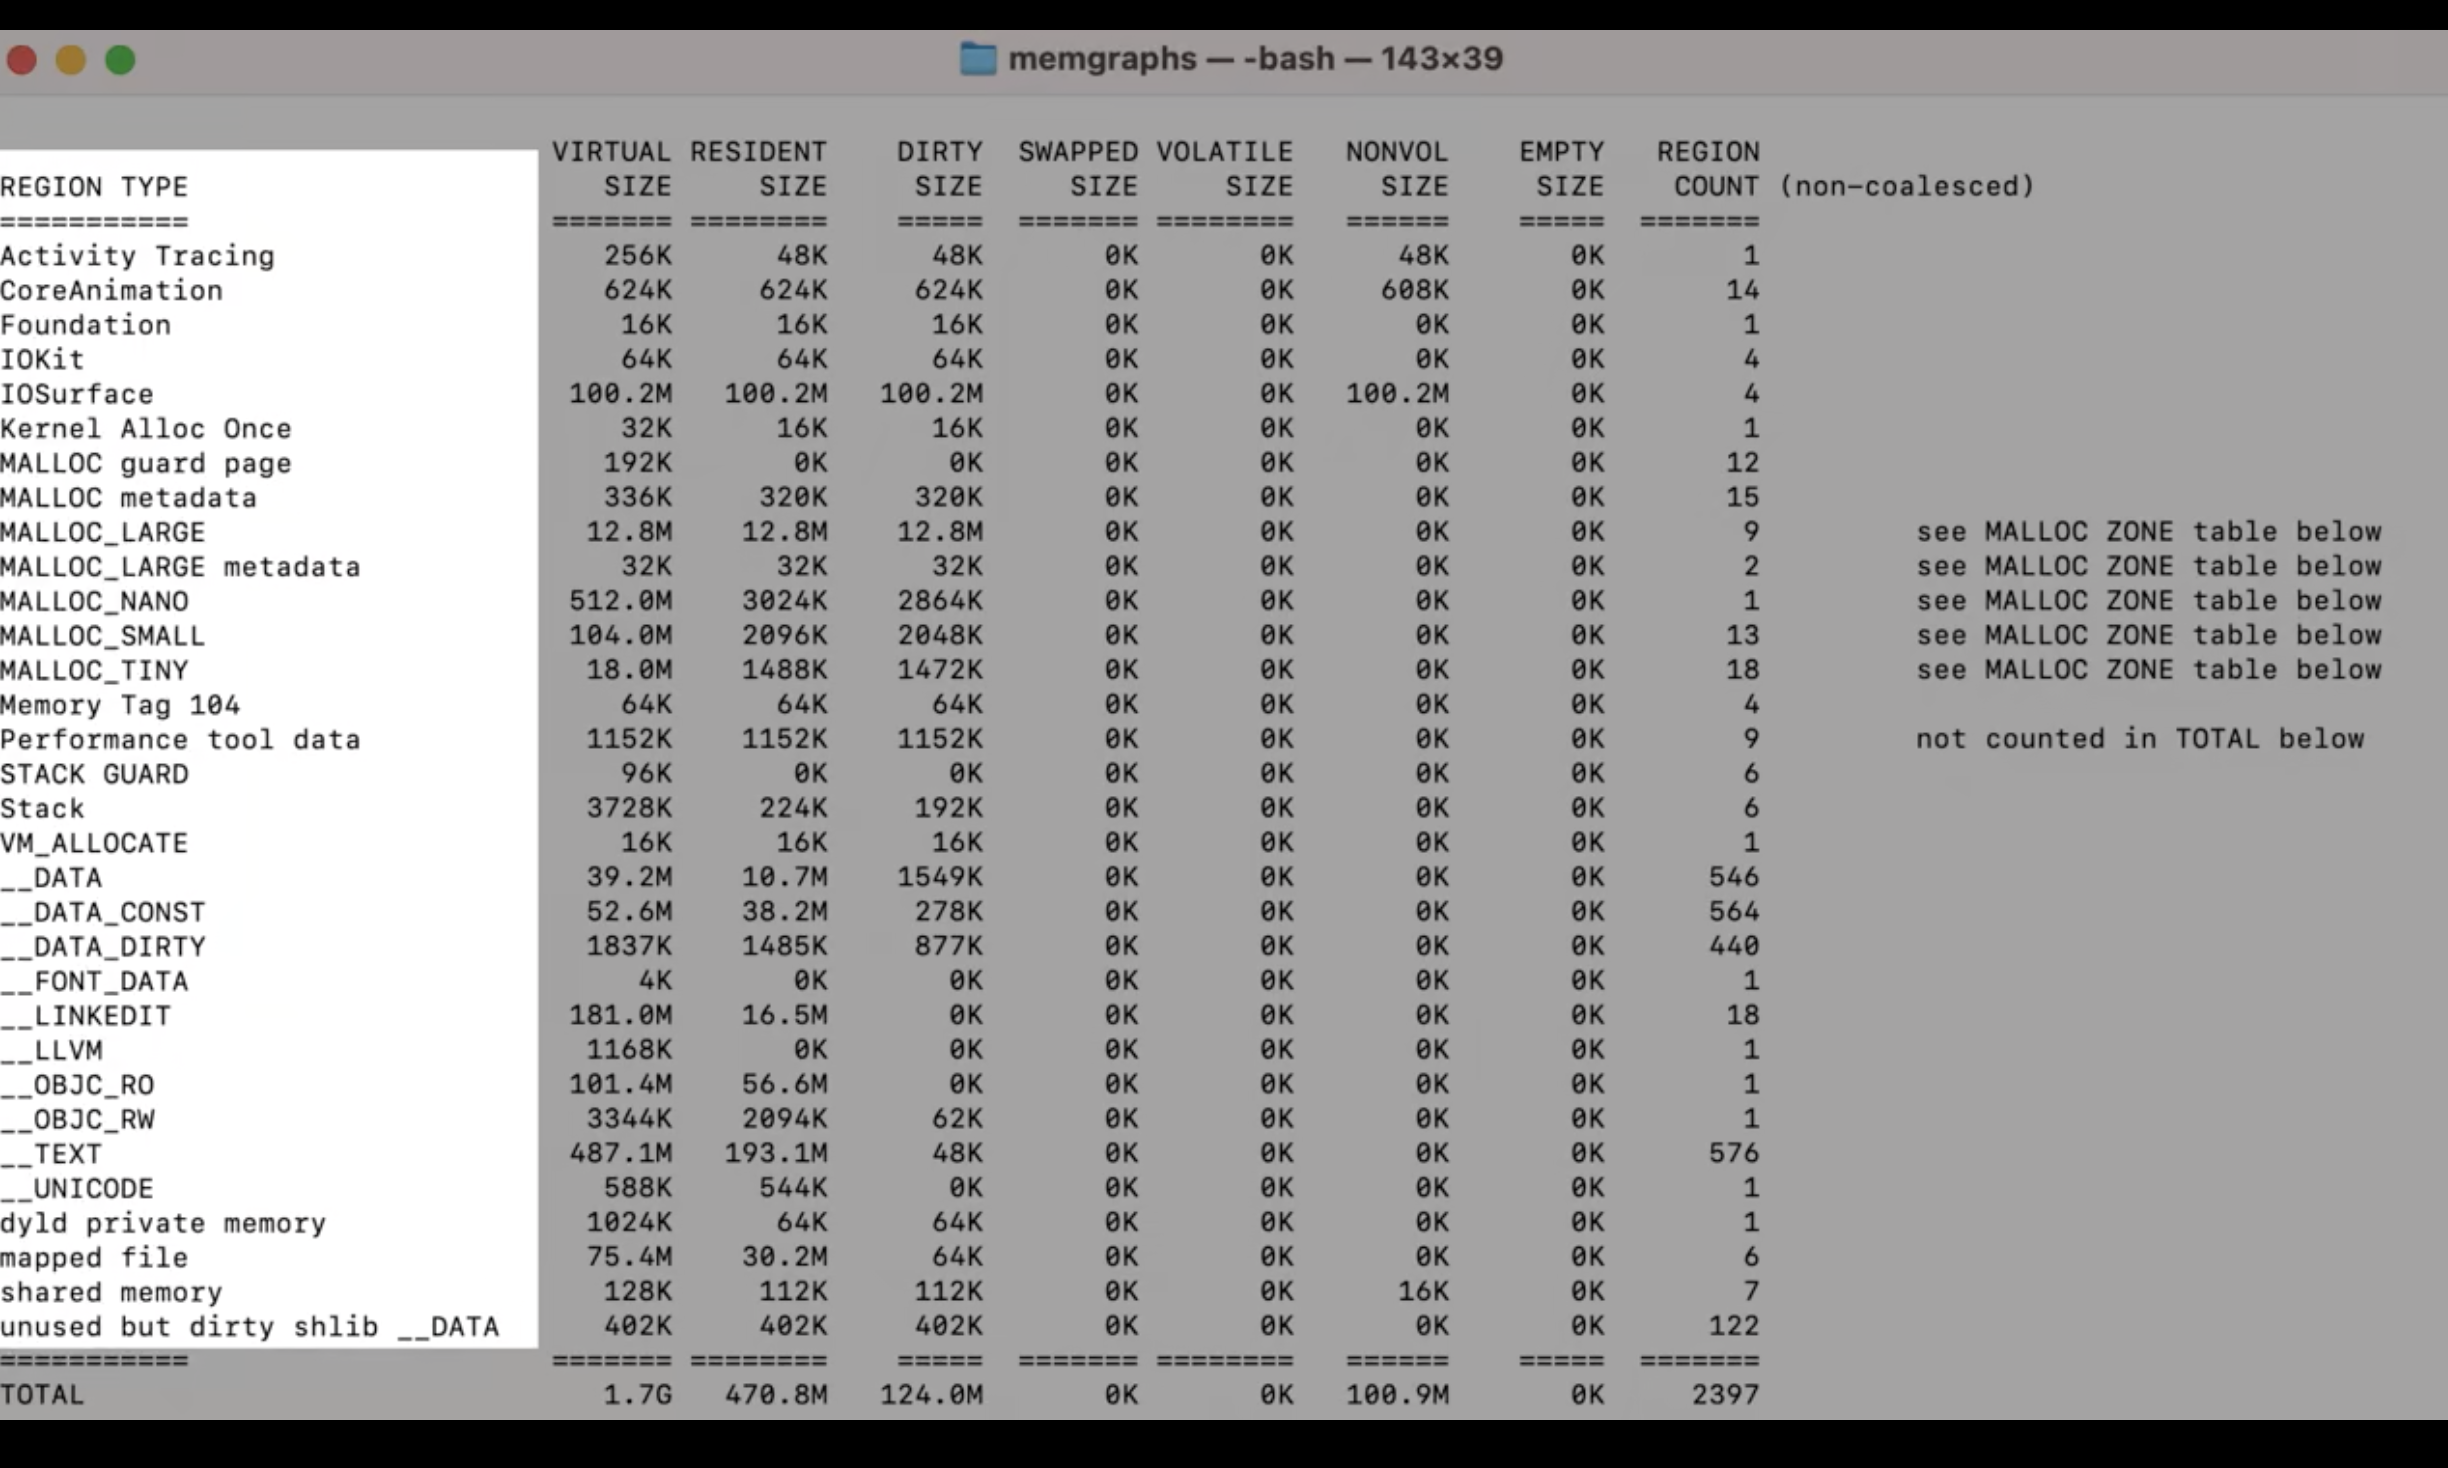
프로세스의 메모리 사용이 region 별로 나눠져 있음
Heap allocation issue 라고 추정되기 떄문에 MALLOC_ region을 살펴보겠음
앞에 나왔던 설명 돌아보면
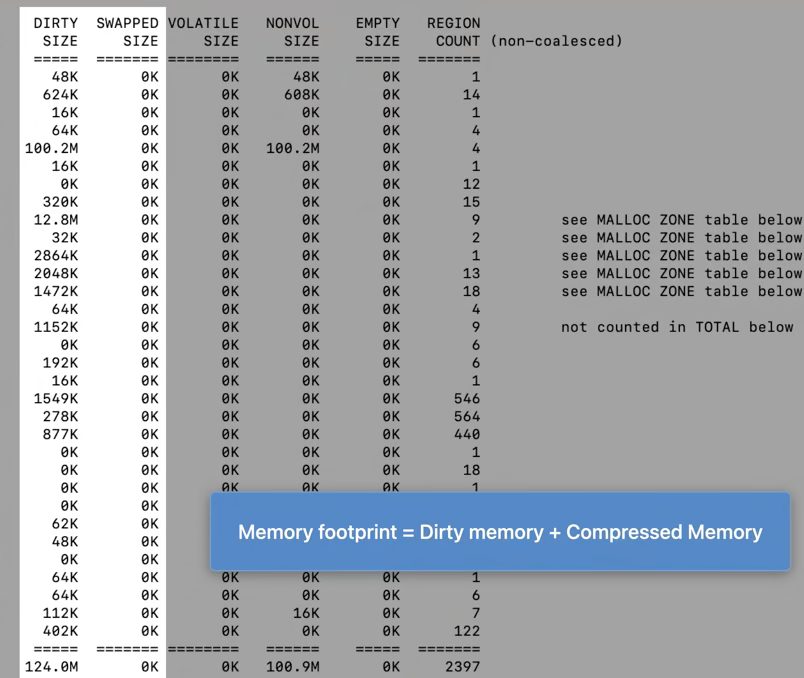
memory footprint = dirty memory + compressed memory 니까, 아래의 두 열을 보면됨.
(compressed = swapped 같은 의미)
MALLOC_LARGE region에 대략 13 MB의 dirty memory가 있음 = 아주 강한 의심이 간다

어떤 object가 관여하는지 더 정확하게 파악해보자
heap -diffFrom을 실행!post 에는 있지만 pre memgraph 에는 없는 것들이 출력됨
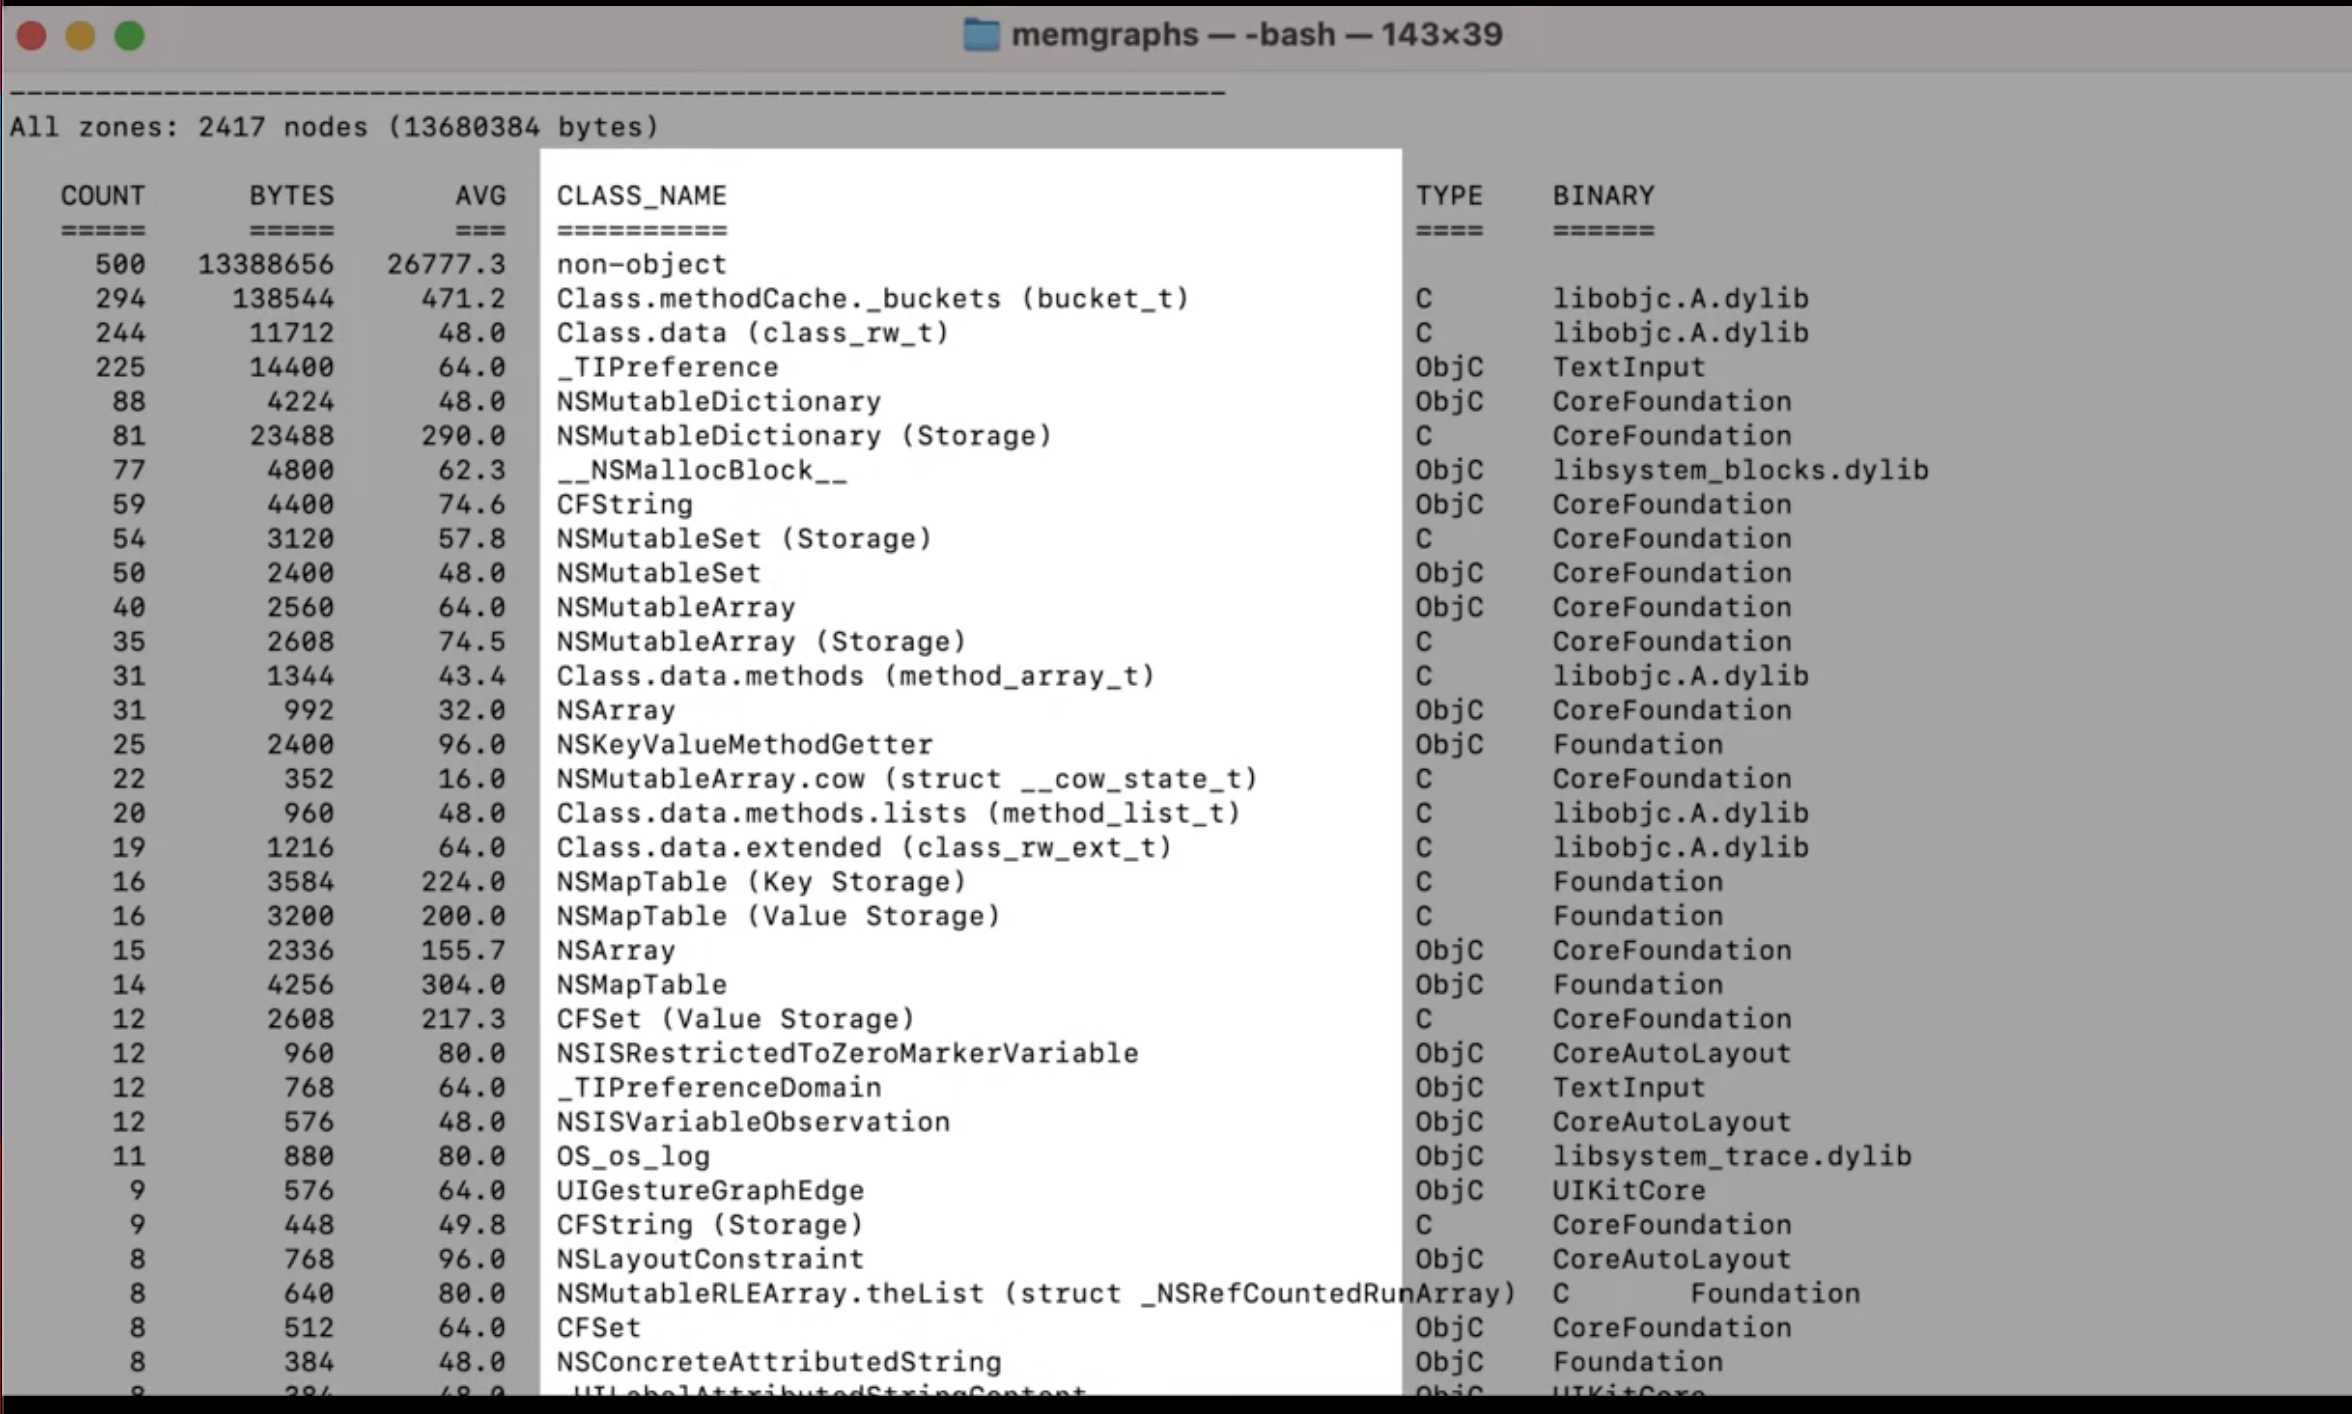
좀 내려보면 메모리를 object 단위로 나눠놓은게 있음.
object의 개수, bytes 볼 수 있음
맨 위에
non-object가 13 MB 정도 차지하는 것을 볼 수 있음ㅠSwift에서 주로 raw malloced bytes를 의미함 (뭐지...?)
non-object가 뭔지 파악하는 방법도 있음!!heap -address명령어를 입력해서 분석. 최소 500kb의 non-object만 찾도록 지정유력한 용의자... 이 주소값을 가지고 다시 찾아보자

몇 가지 방법이 있음
leaks --traceTree특정 객체에 대한 정보는 없고 주소값만 있을 때 사용해 볼 수 있음
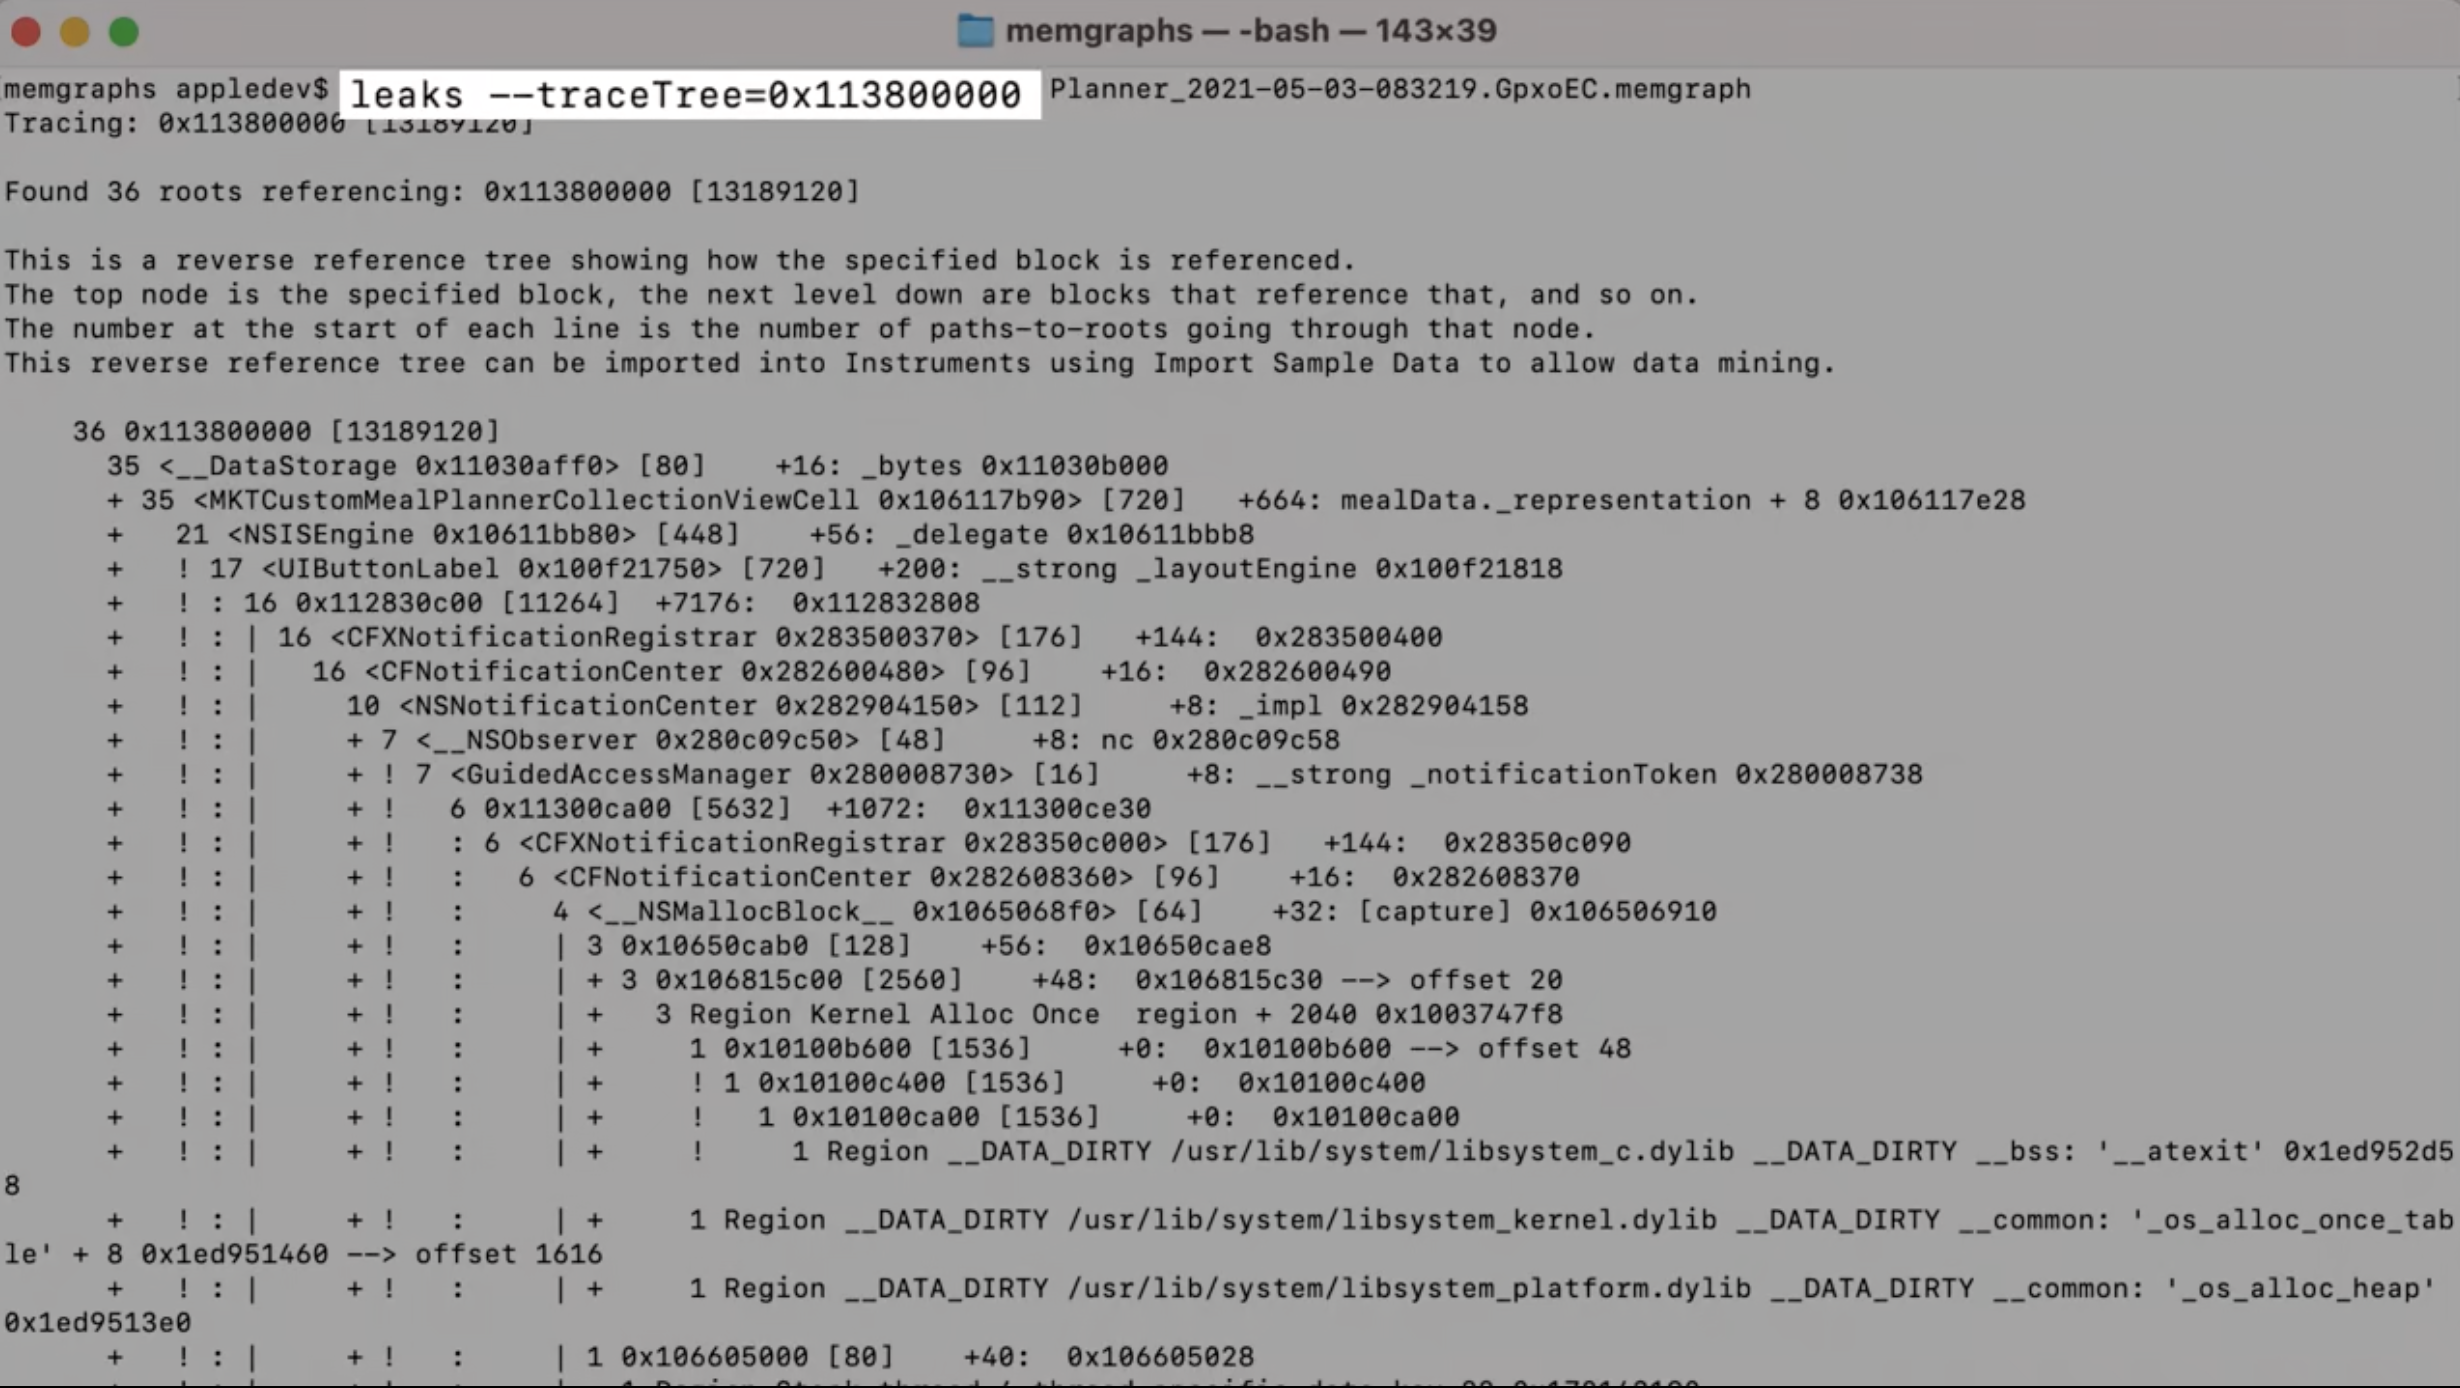
아마도 MKTCustomMeal PlannerCollectionViewCell 과 관련이 있어보임
leaks --referenceTree모든 메모리의 top-down reference를 보여줌
--groupByType 옵션 주면 좀 더 보기 편할 수 있음
malloc_history -fullStacks이 object가 어떻게 allocate되었는지 파악할 수 있음
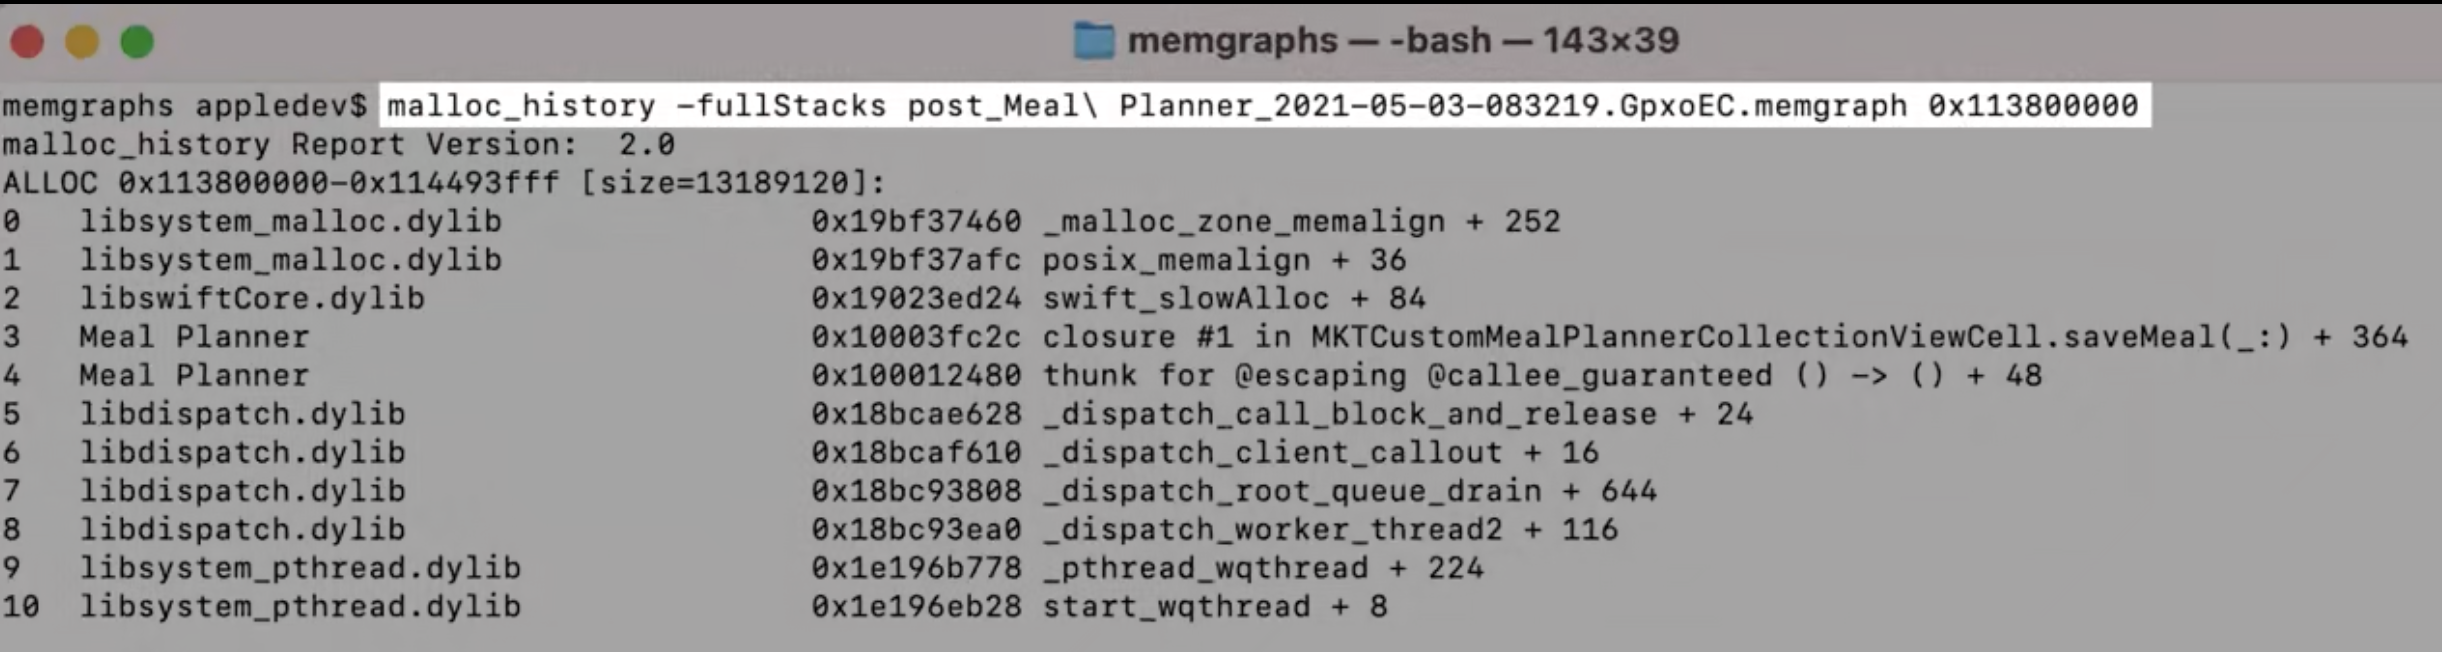
여기서 allocate 되었음을 파악할 수 있다
코드 수정
mealData는 saveMeal 되고나면 필요없는데 Cell이 유지되는 동안은 계속 남아있게 됨
saveMeal 이후에 mealData를 nil 처리 하는 방안이 있음
3-3. Heap size issues: Fragmentation (조각화, 파편화)
iOS에서의 Page 작동원리
Fragmentation
처음엔 Clean
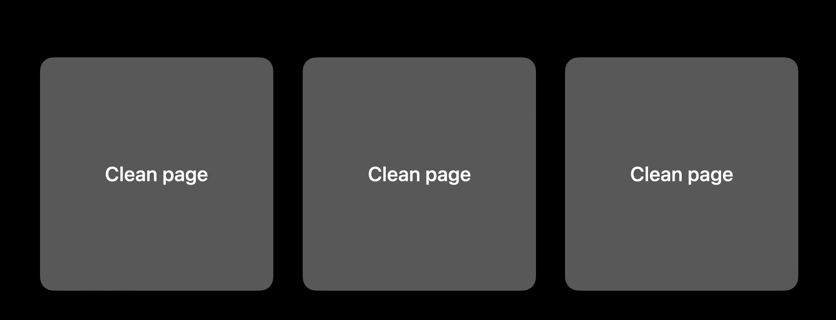
프로세스가 작동하면서 Allocated object가 page를 채움
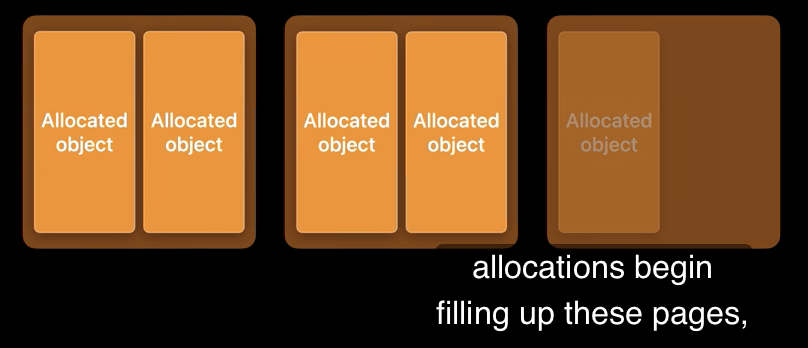
일부 Object가 deallocate 되면서 free memory가 됨.
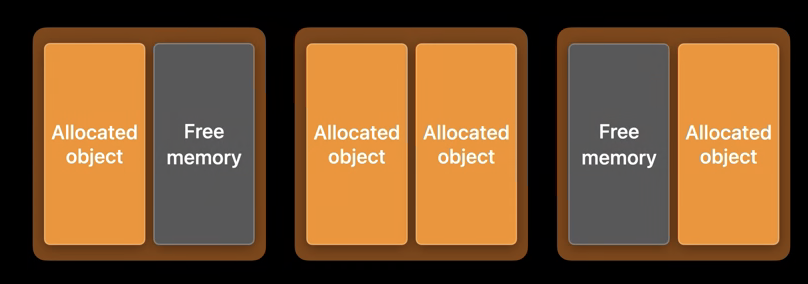
하지만 여전히 allocated object가 있기 떄문에 여전히 dirty page.
시스템은 이 빈공간을 채우려고 함.
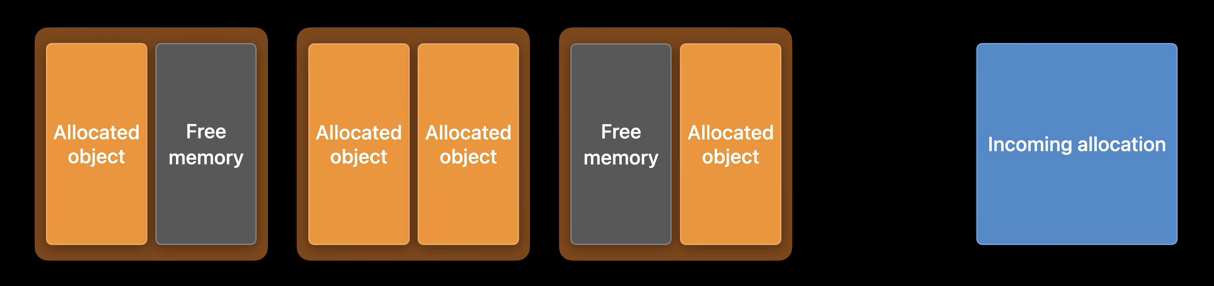
파란색 크기의 allocation이 있다고 가정함.
빈공간을 합쳐보면 파란색 allocation을 받아줄 수 있지만, 한번에 allocate할 공간은 없음
기존의 슬롯을 활용할 수 없기 때문에, 새로운 dirty page를 사용하게 되었음.
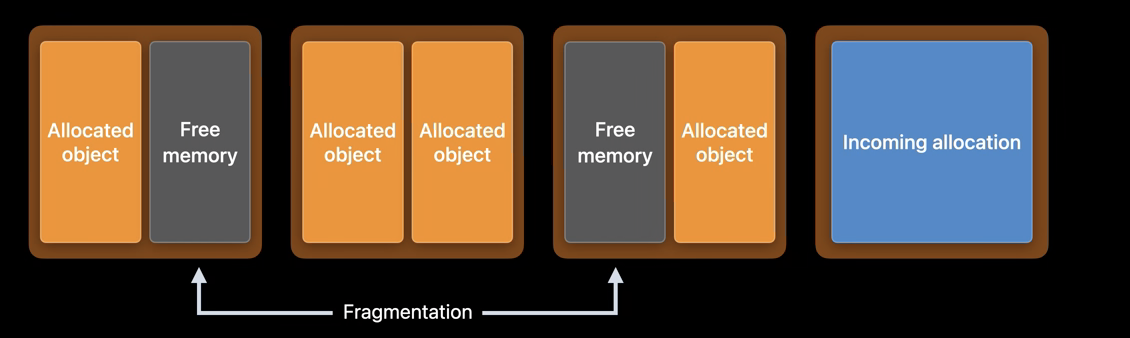
이렇게 free memory가 부분적으로 남아있는 경우를 Fragmentation 이라고 함
fragmentation을 줄이기 위해서는
메모리에서 유사한 lifetime을 가진 object끼리 allocate 하는 것이 가장 좋은 방법
동일한 Object는 모아서 allocate
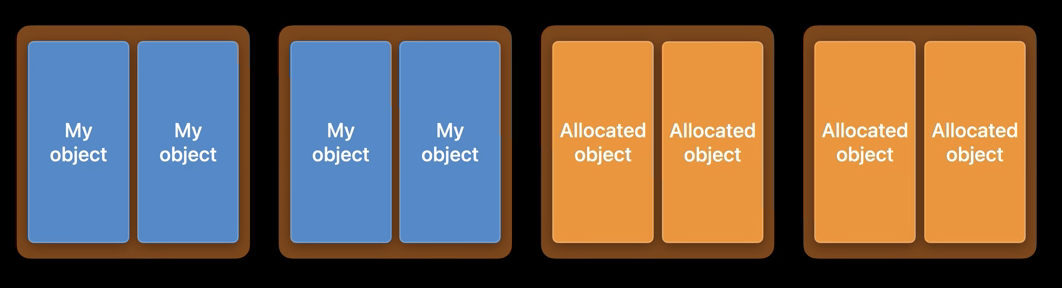
이러면 Object가 deallocate 되었을 때 Clean Page를 확보할 수 있음
실제 시나리오에서는
이슈 살펴보기
vmmap -summary입력해서 볼 수 있음DIRTY+SWAP FRAG SIZE를 보면 정확히 낭비되는 공간을 볼 수 있음
Instruments Tool > Allocations
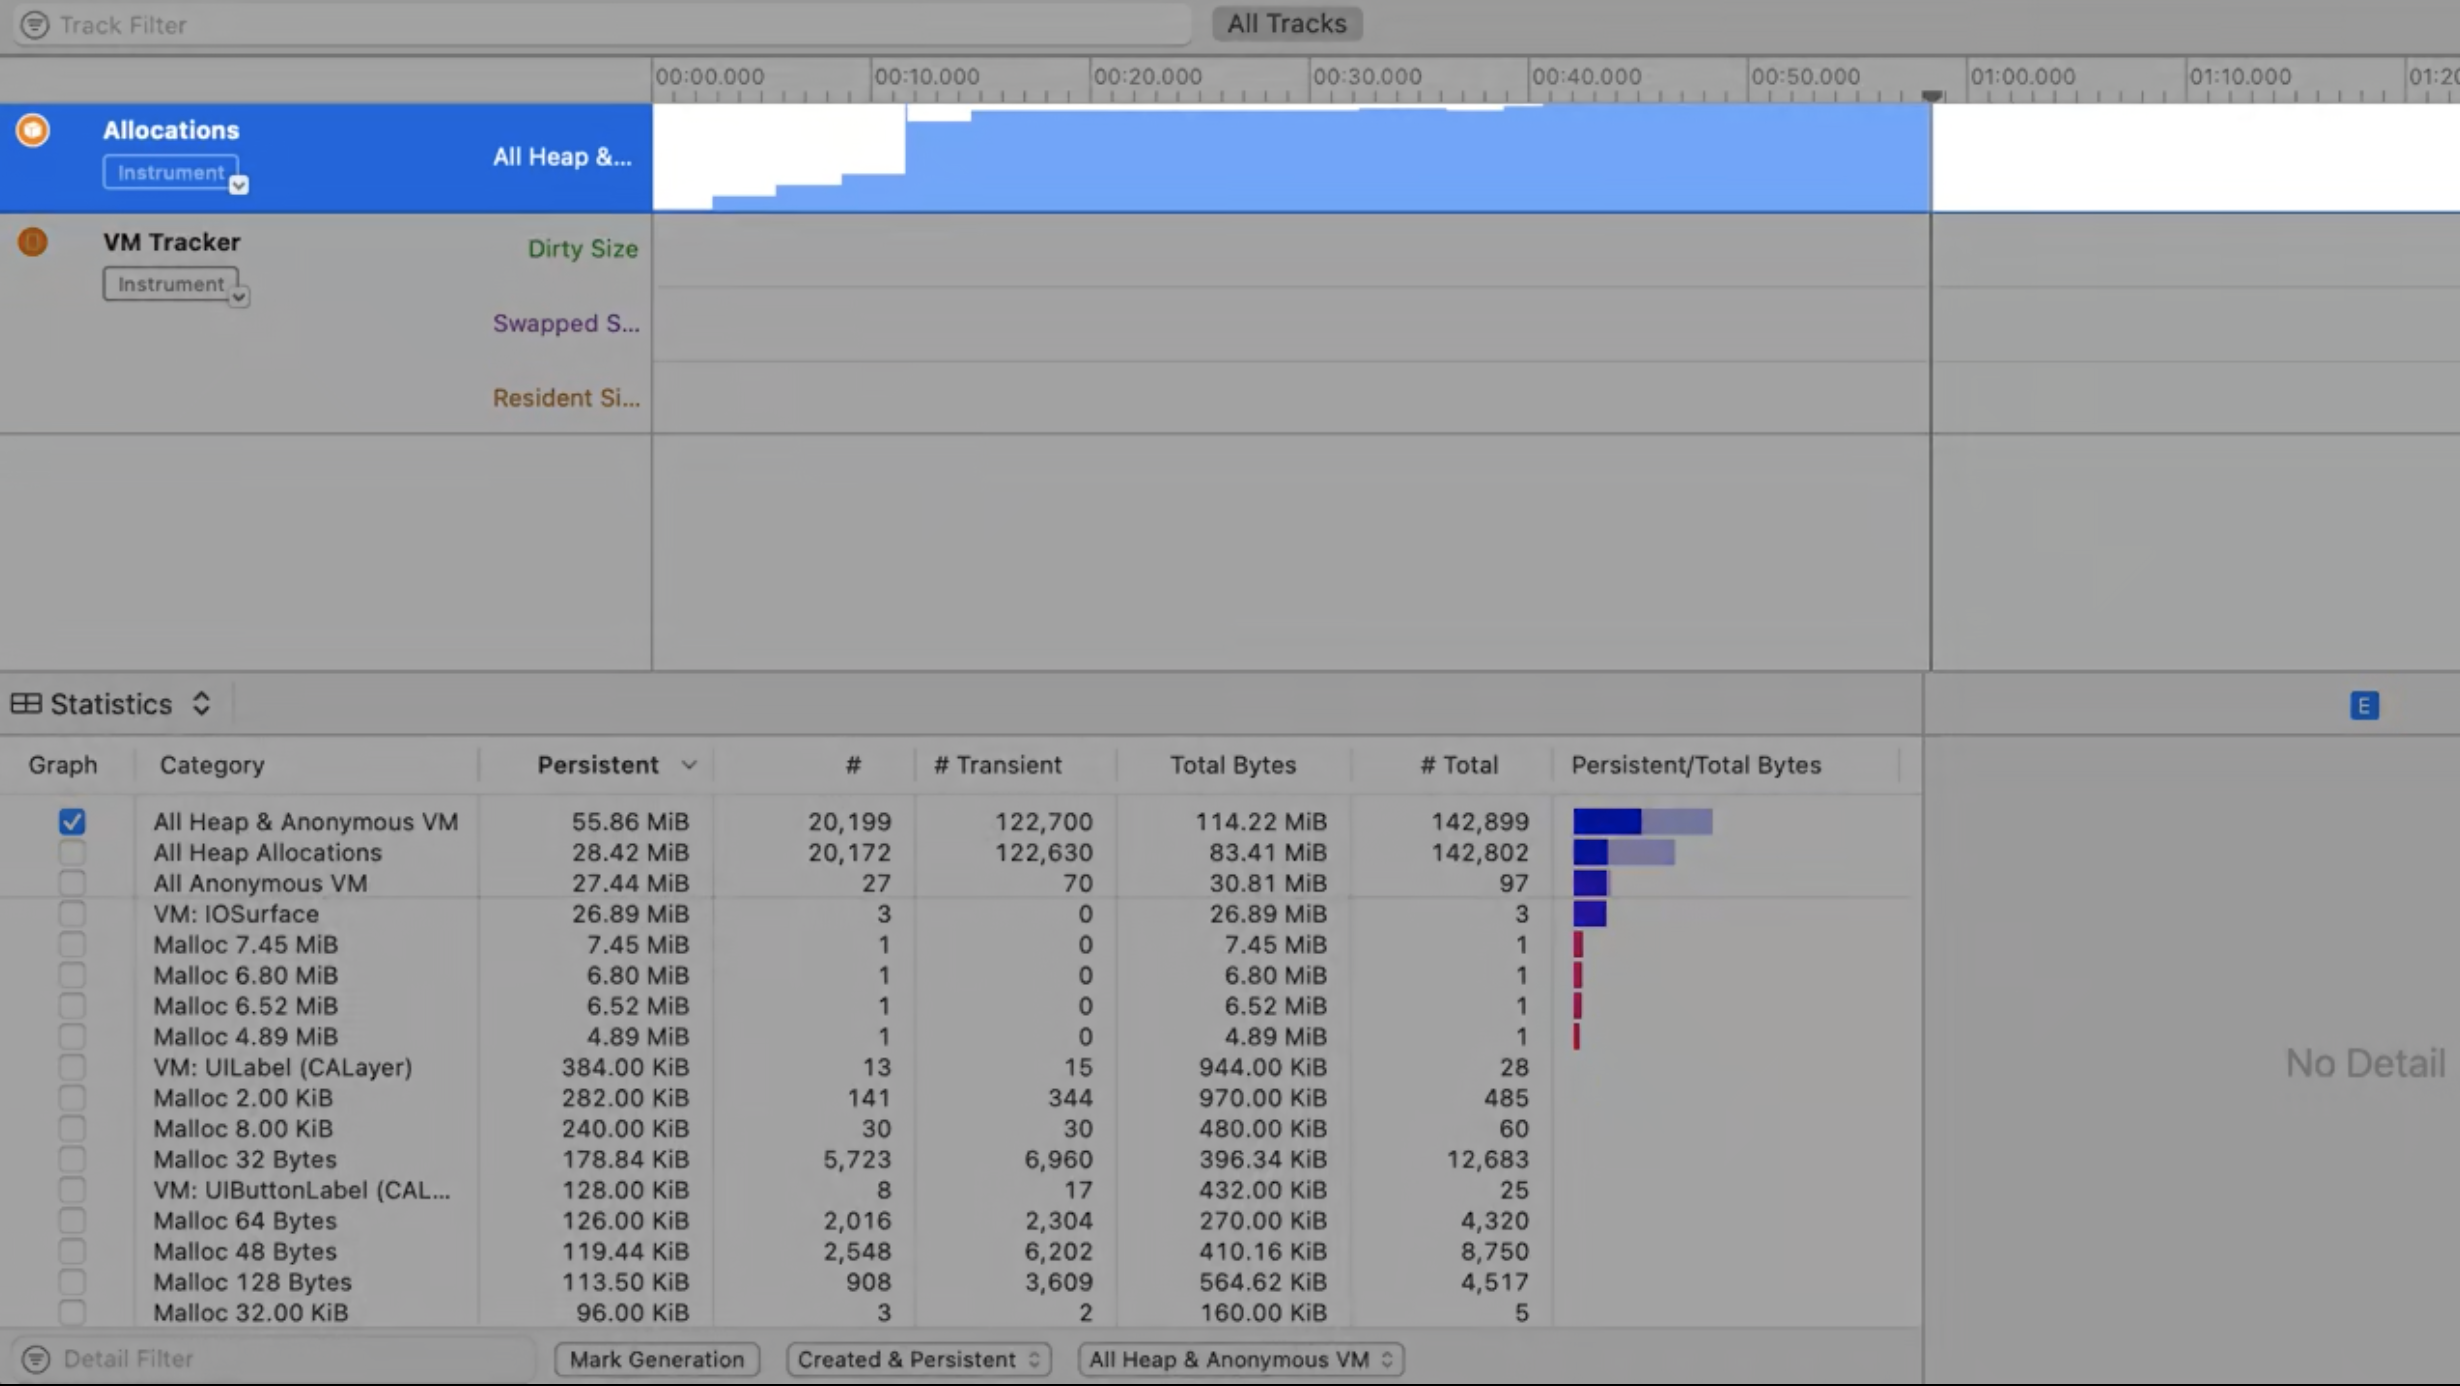
Allocation List, Created & Destroyed를 체크해서 확인
Instruments tool 사용을 좀 더 알아보려면 -> Getting Started with Instruments
Detect
모니터링
새 기능 추가 후에도 XCTest를 작성하여 지속적으로 퍼포먼스를 모니터링 할 수 있음
이슈 분석
The text was updated successfully, but these errors were encountered: