Components not being garbage collected by browser, causing major memory leak #45080
Comments
|
Have you tried your reproduction in incognito without extensions? I ask as my edge & chrome browsers don't show the leaking behavior. Even after 3 minutes the app is stil at 5.5 MB heap for me. Maybe there is an extension that retains dom nodes. What do you see if you open the tree on detached html in the screen you provided https://i.stack.imgur.com/hkyw8.png, is there is hint about who holds onto the memory? |
|
I haven't tried running the app yet, but one thing that stands out is the presence of |
|
I am grateful that there are eyes looking at this issue. Thank you both for replying. I have attached an image of the command I used to run the memory killer app below (showing that it's running in production mode).
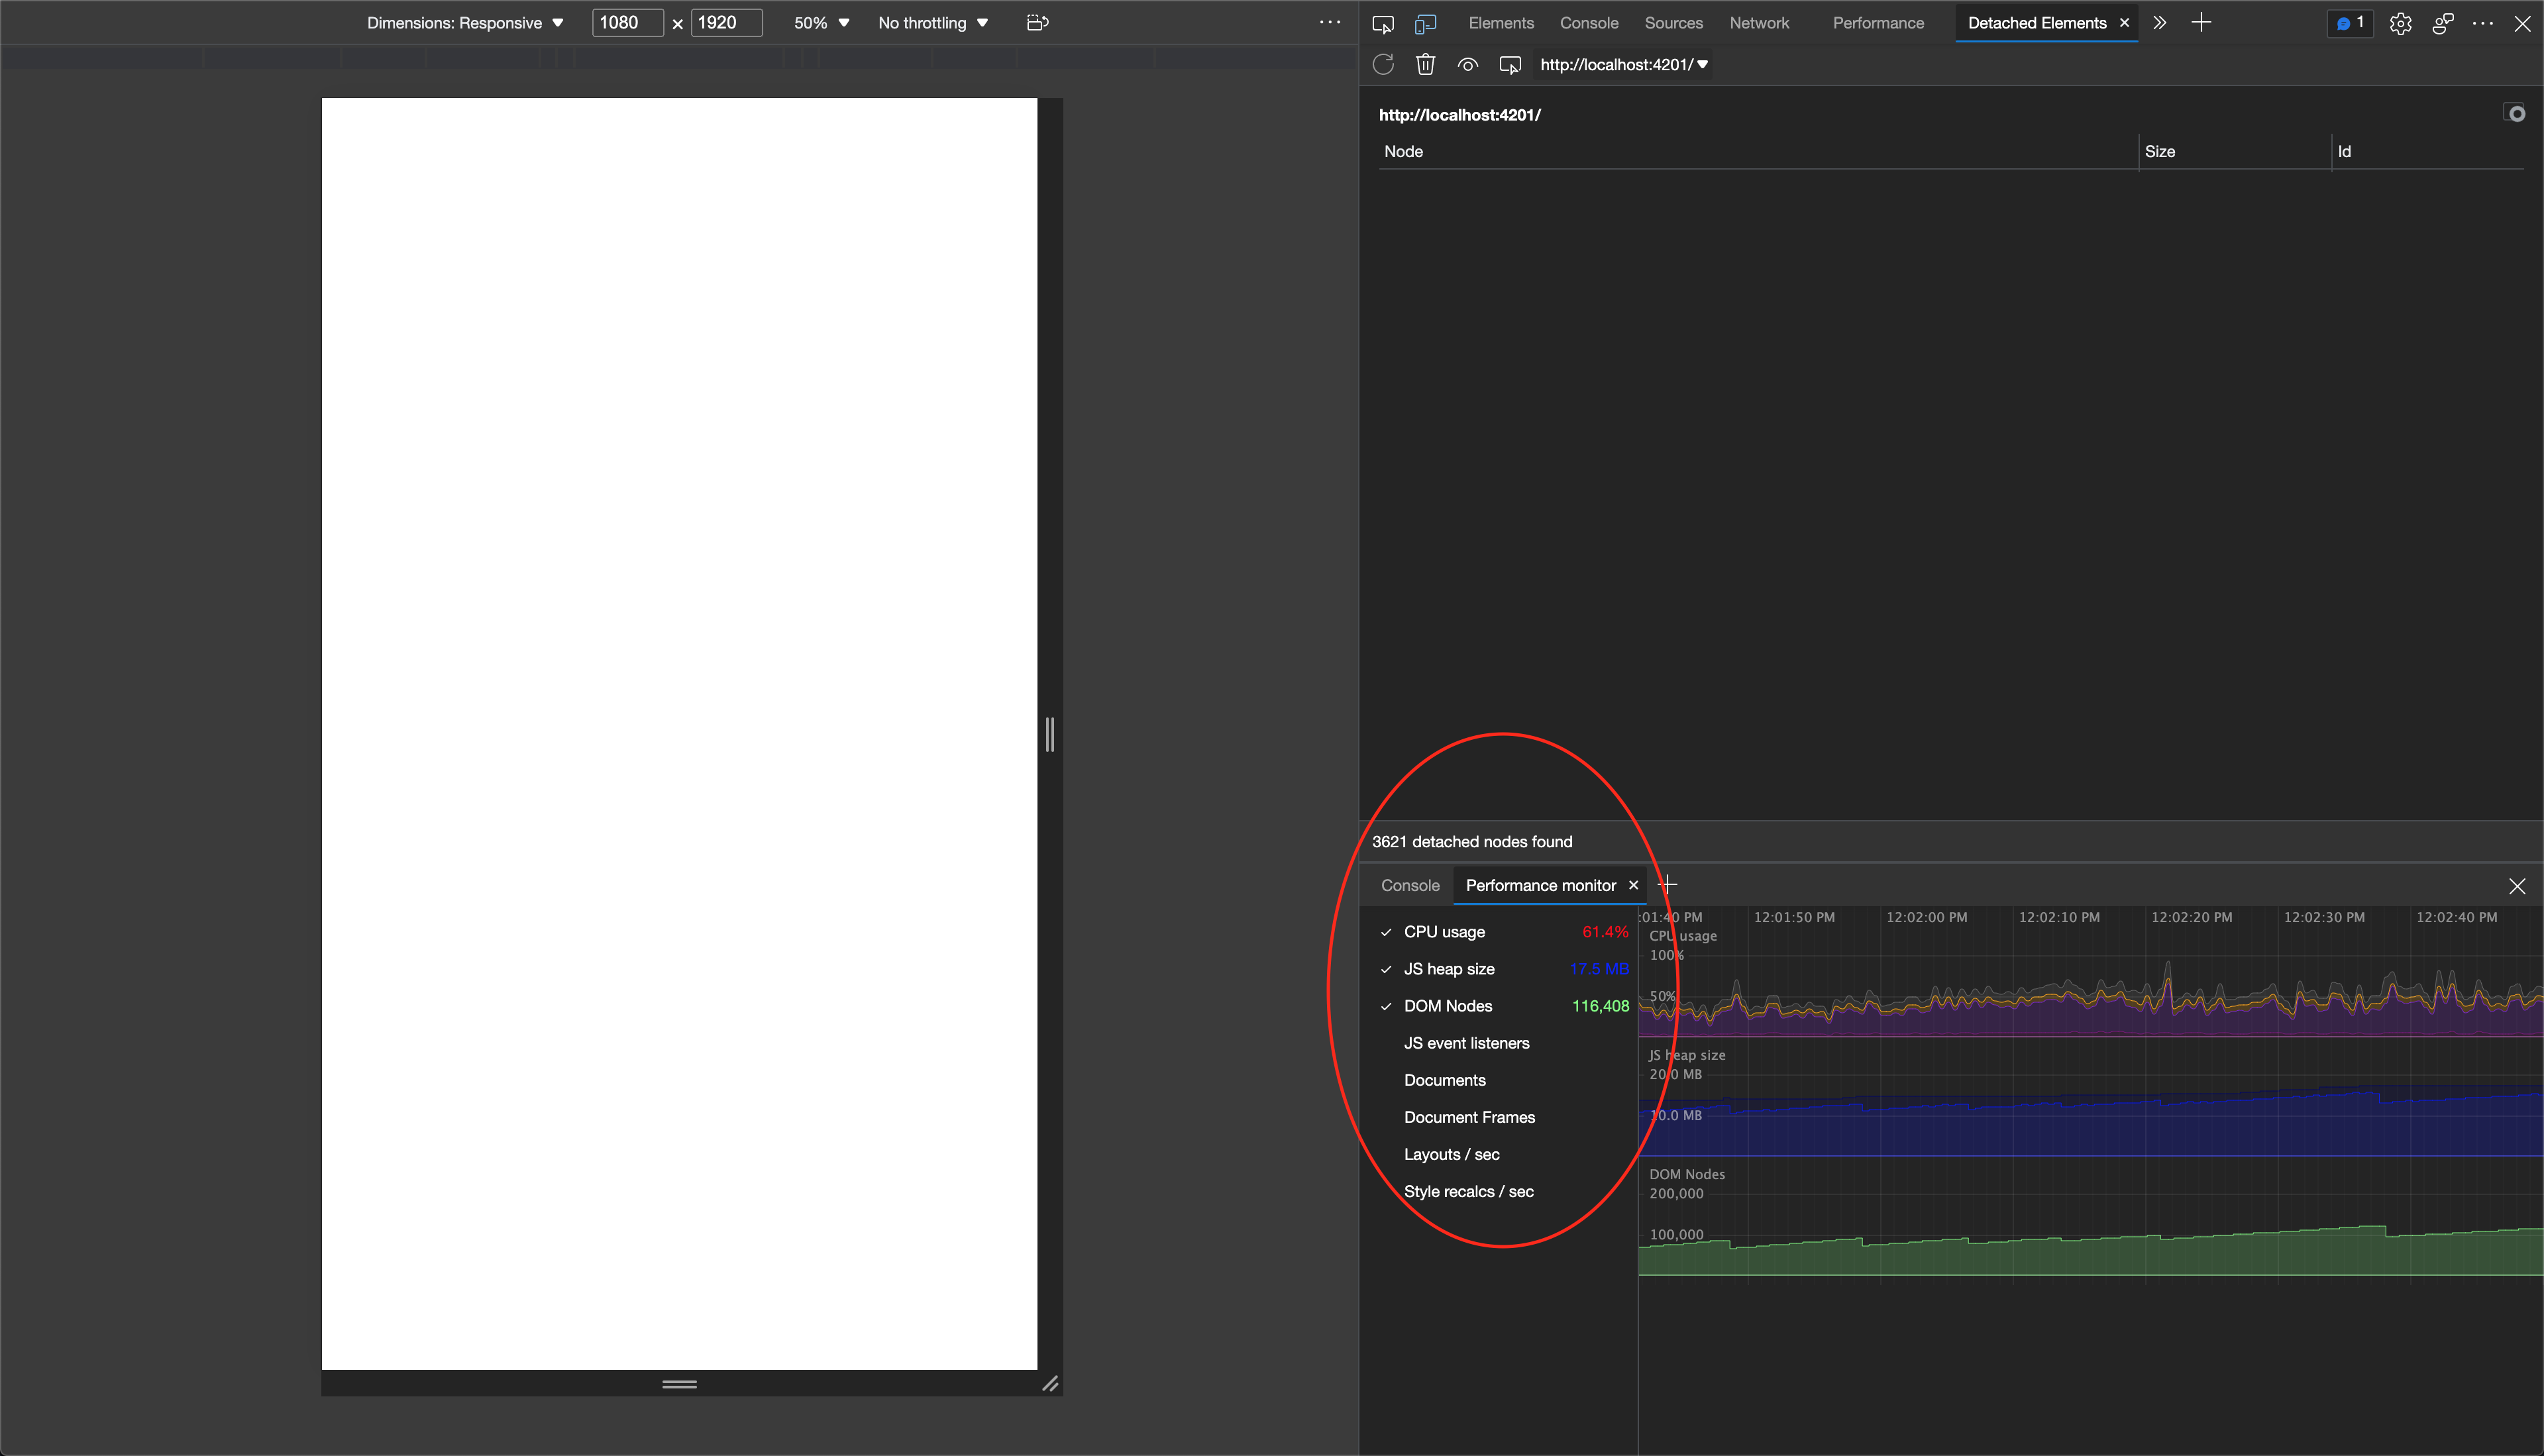
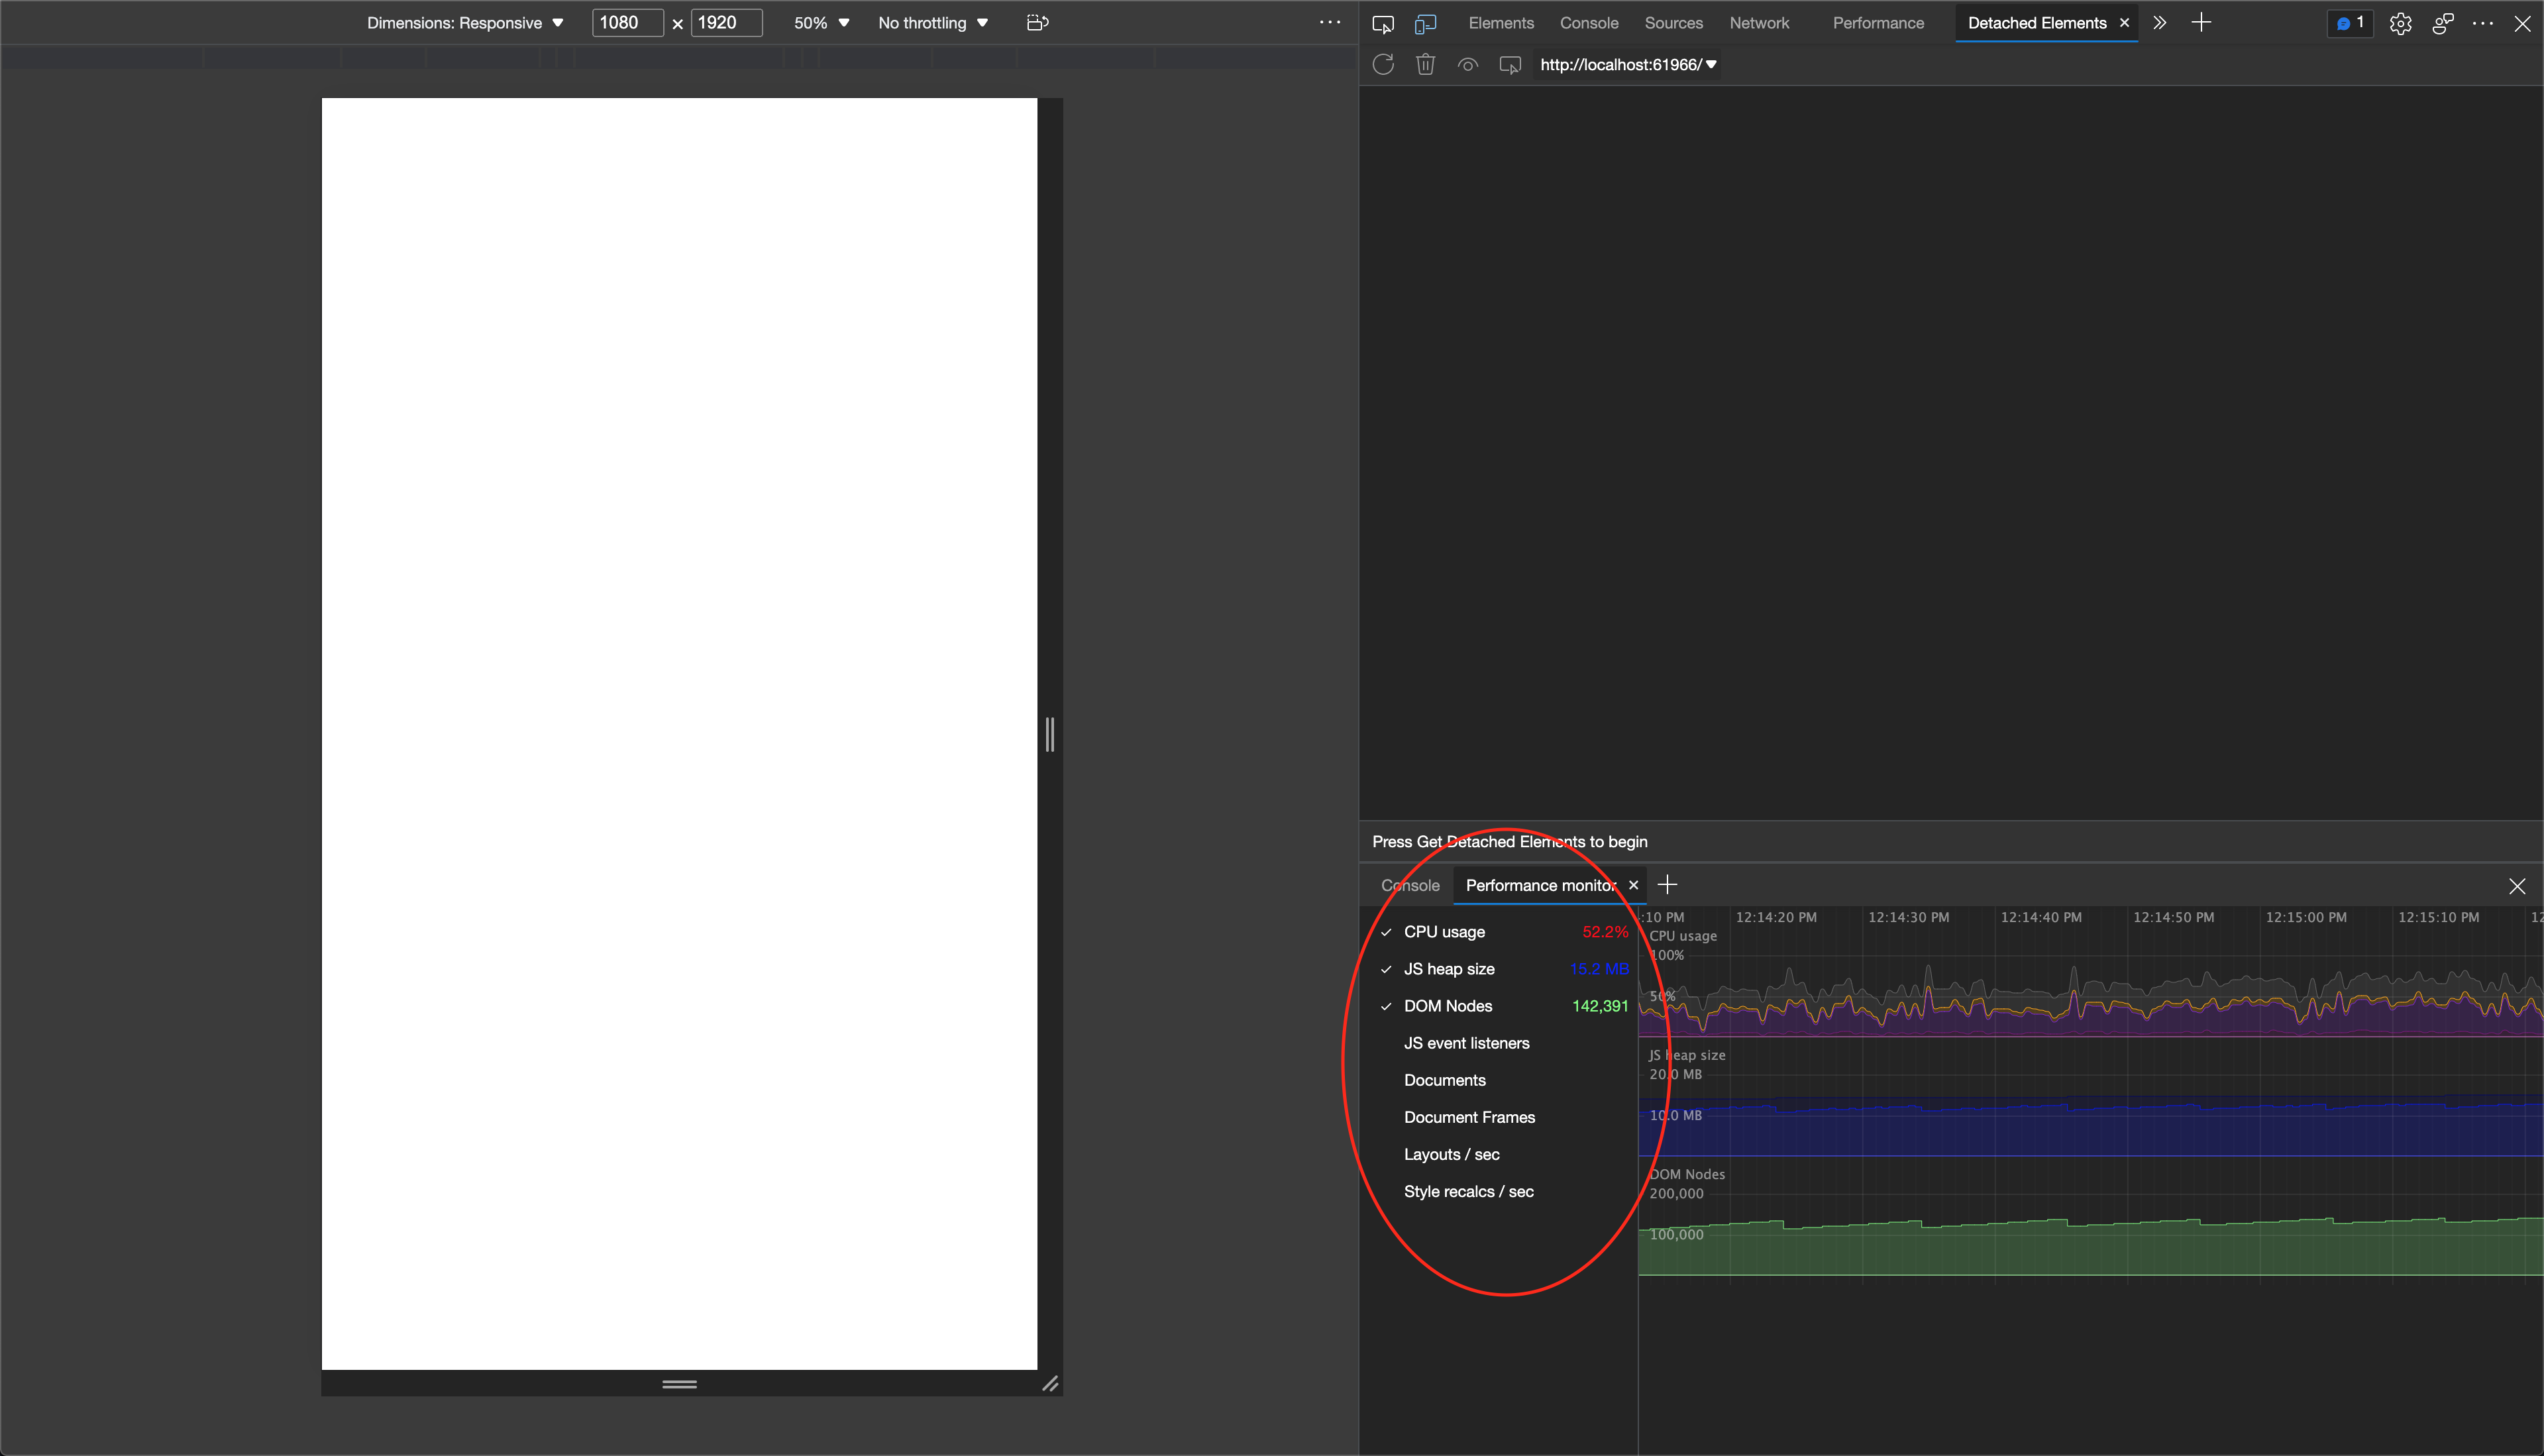
I've also included a video showing me manually clicking the garbage collection button (while the app is in production mode), but the browser still can't collect the nodes, because it appears the angular components keep a reference to something that won't allow them to be collected, so they retain their size, and aren't being collected. angular_leak.mp4@sod the original images I took were ran on Edge without extensions, and chrome with extensions. I only downloaded Edge in order to use their nifty detached elements feature. It's hard to tell what's keeping a reference by looking at the memory inspector. I find it more confusing than helpful in this situation. @crisbeto I've been able to get this memory killer app to work in both production and development mode. My coworkers have been able to see the memory leak on their machines as well (in both modes), but like I said above, it seems to be hit or miss on whether or not it happens first try. If it doesn't, we usually open it in a new tab (sometimes let it run for a bit), then close it, and repeat this process until it does start leaking memory. It's easier to tell if it's leaking by using Microsoft Edge and its experimental feature called "Detached Elements". If you don't, then you have to take memory snapshots and see if the DOM nodes are retained (this takes longer). I really hope that you both can reproduce this, so that this issue isn't overlooked. |

|
Hi all. Thank you @sod and @crisbeto for looking into this. I want to provide some context to the use case that is burning us in our business' application. What @kevinpbaker has provided is a stripped down version of the app functionality to easily pinpoint the memory leak - this was a process we went though while debugging. We think it may have to do with the 'flex' attribute, but was unable to confirm this 100% (See stack overflow post with some additional details) BudSense provides simple menu management and merchandising solutions for legal cannabis retailers. As you can see in the below video, our software will loop through 'menus' as specified by the store operator. This issue happens when there are 3 menus being looped. 1 menu in the foreground, 1 rendered in the background (so it's ready to present) and the third should be deallocated when not in position 1 or 2. This action is not happening, so every time the menus switch, a new detached node gets added, and the heap size grows. Our clients run this Display app on a mix of devices, but primarily it can be bucketed into 2 categories:
These menus run all day while the stores are open, so as you can imagine the memory leak bubbles up and the app crashes every few hours (depending on the memory available on the hardware device) Reproducing and solving the issue on the stripped down app included will be best path forward, but I just wanted to provide some context as to where this is being used and some more information in that regard. Below are the links to the actual product menu, screen recording of the detached nodes increasing, as well as some screenshots of heap snapshots. Menu URL: (run in portrait orientation 1080 x 1920) |


|
I have tried my side on chrome and edge both in incognito mode and I don't see any memory leaks, tried multiple times, repeated refresh.. heap is still around 5. Have you tried performance monitor that is available on both browser that shows real-time memory usage and DOM nodes count.. |

|
@yousafnawaz hence why my mental health has taken a massive blow. Like I said, sometimes it does it, sometimes it doesn't. This morning it was happening on my coworkers computer, and now when he tries it, it no longer does it. I've tested this on a 2015 Macbook Pro with an Intel chip, a new Macbook Pro with an M1 chip, a windows desktop computer, and a windows Lenovo laptop (all with incognito mode, and regular browsing). All will sometimes leak, and sometimes not. Therefore, it is not a computer specific problem. However, trying to prove that it is a problem has become something that keeps me up at night. Here is a video of it leaking on both Microsoft Edge and Chrome (side by side): angular_edge_and_chrome_leak.mp4 |
|
@kevinpbaker, the link shared by @andrewcretin |
|
Environment: I was able to get the app to leak memory in both prod, as well as dev, in an incognito window ensuring no add-ons. I have attached screen shots below highlighting the leaks. As expected, this took me quite a while to reproduce. It took about 20-30 minutes of constantly refreshing, dumping cache, opening new tabs, quitting edge entirely, etc. The goal now is to figure out the exact reproduction steps, as right now it seems to be completely random, which does not make any sense whatsoever. Dev: Prod: |
|
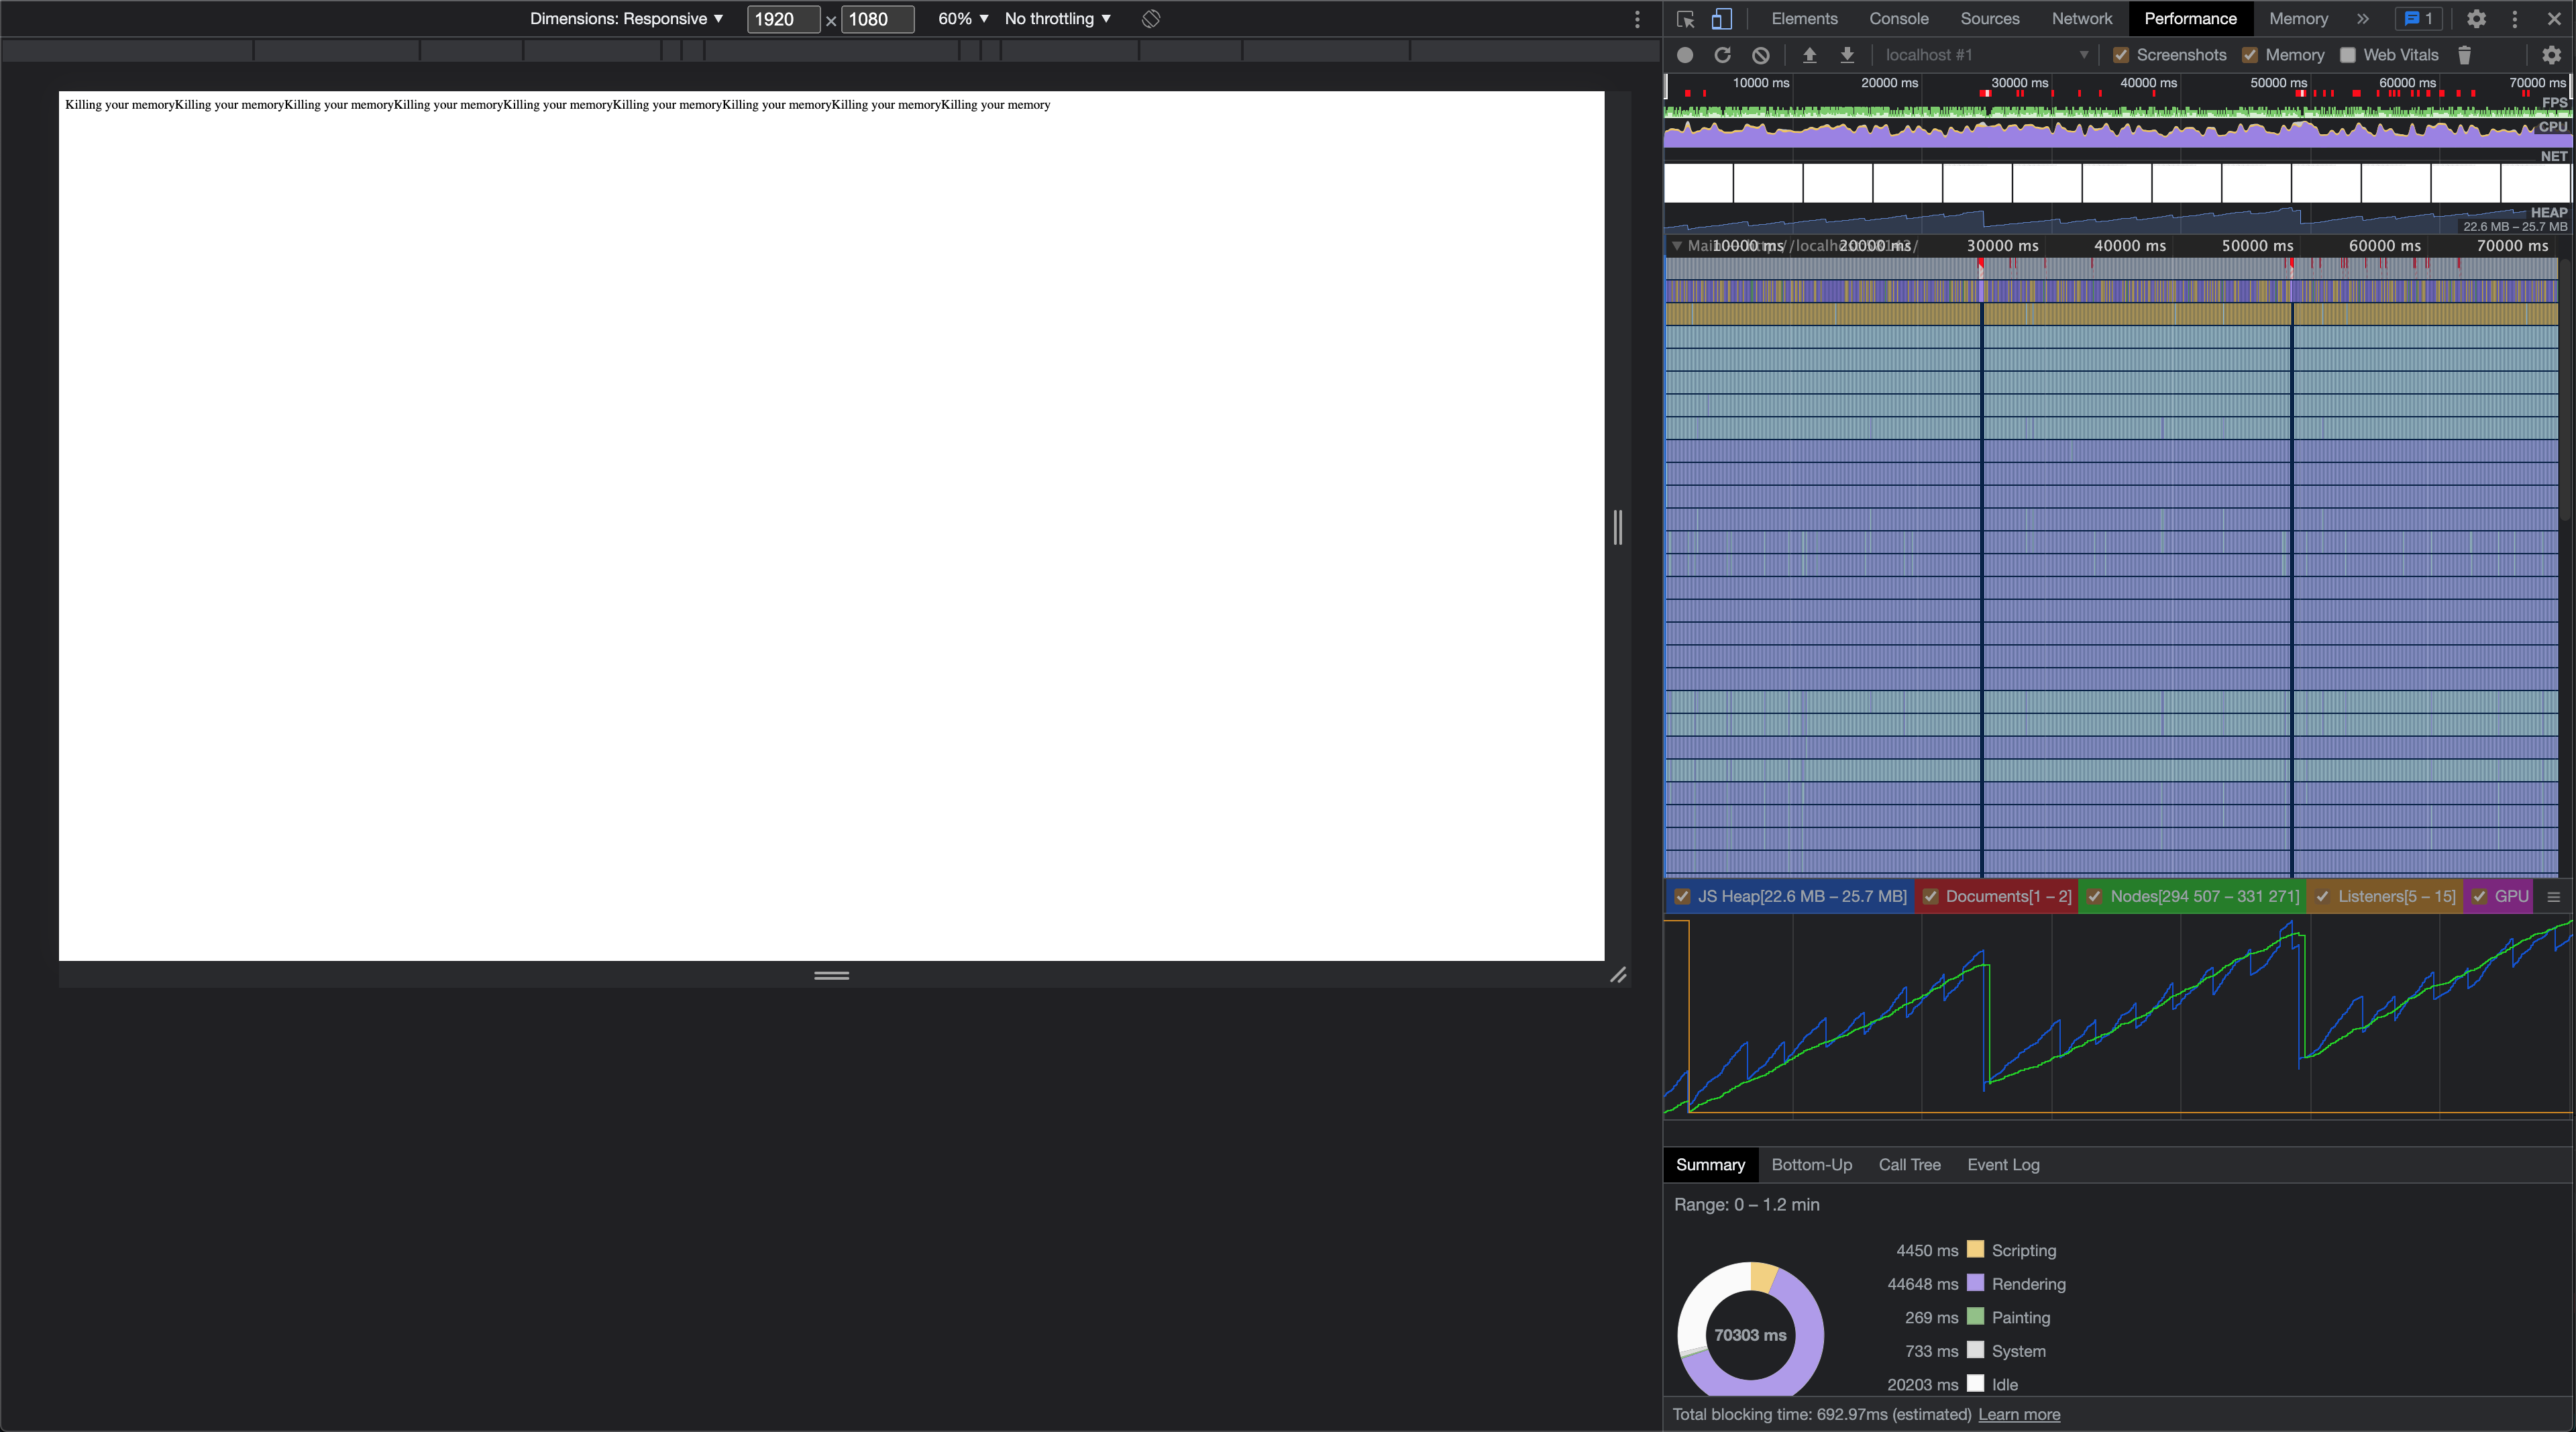
I was able to once again reproduce the memory leak running the Memory Killer in prod, this time on Chrome v 96.0.4664.110. Again, it seems to happen randomly, and thankfully it happened on my 4-5th refresh. I am not too sure if these will be useful, but I took some heap snapshots 10 minutes apart once the leak occurred. The first heap snapshot can be downloaded here. At this point, the heap was roughly 13MB. I took a second snapshot ~10 minutes later, and the heap was roughly 24MB, and still trending upwards. The link to download that one can be found here. Again, I am not sure if these will be much use, but I am just trying to gather as much data as possible. Finally, I did a quick one minute performance recording in the inspector, and I have included a screenshot below. I tried to let it run for a couple of garbage collection cycles, so you can see the heap gradually increasing.
|
|
Hey! So, I might be WAY off here...I'm currently studying Angular's inner structure, trying to understand how it works on a lower level and I thought this issue would be a good way to dive deeper, even though I'm kinda out of my league here hahahhah I was doing a few memory snapshots with the BudSense link provided, and it seems like there's a lot of self references throughout the detached elements (detached HtmlDivElements wich references themselves and other HtmlDivElements, which also do the same thing - as if they were detached but those cross-references kept them from being collected). Couldn't it be caused some kind of component hierarchy (an abstract component extended by one or more components) with self-references through ViewChildren or other query-like features? |
|
I tried running both the memory killer app and the menu app mentioned above, but I couldn't get it to leak more than 13 DOM nodes which would usually be GCed on the next snapshot. There's a recording of my timeline below. Screen.Recording.2022-02-17.at.13.24.02.movLooking at your heap dump, it does have some references in export class MemoryKillerComponent {
constructor(private _elementRef: ElementRef) {}
ngOnDestroy() {
[
this._elementRef.nativeElement,
...this._elementRef.nativeElement.querySelectorAll('*'),
].forEach((el) => {
el.__ngContext__ = null;
});
}
} |
|
@crisbeto it looks like you haven't been able to get the app in the state where it uncontrollably retains memory. This deeply troubles me, because I can get it into this state fairly consistently. I read through #41047 and #45051. I also tried adding the code that you specified to the memory killer app while I have it in the leaking state, and it still leaks memory. I do see this ngContext in the memory snapshot when using production mode (when the app is leaking). Forgive me, but this ngContext gives me more questions than answers. Questions:
I've discovered when I get the memory killer app in the leaking state, that If I remove the display: flex attributes from the component classes, then the components get garbage collected properly. If I then add them back, it immediately goes back into the leaking state. When I say leaking state, I don't mean the state that you showed above, I mean the state that we've been able to get the app in, which will leak to the point of failure. This leads me to my next question:
I will continue to be as helpful and as skillful as possible in documenting this issue, so that we can eventually pinpoint exactly what the problem is. |
|
To answer the questions:
As for reproducing it, it's entirely possible that I'm not doing something in the same way as you or there's something in my environment that prevents it from happening. What I did today was to One thing worth trying is to check if the leak happens in other browsers like Firefox or Safari. It would at least help us narrow it down to a framework issue or a potential problem with a browser. |
|
@crisbeto after a lot more testing, I think this issue is specific to Microsoft Edge and Chrome. I was unable to get Safari or Firefox to leak memory using the memory kill app provided. SafariThe memory footprint in Safari will always climb and then plateau. Even if I spam the garbage collection button it remains at or below the plateau value. Here is an image showing this behavior: FirefoxThe memory footprint in Firefox gets cleaned up regardless of how many times I try to get it into the leaking memory state. Here is an image showing this behavior: While doing this I had all 4 browsers running at the same time. All of them running the memory killer app. Microsoft Edge and Chrome would leak memory, but Safari and Firefox would not. From the tests and information above, I think we can conclude that this isn't an Angular Framework problem, but a browser problem. Also, one of the computers is factory new that I used to leak memory on Microsoft Edge and Chrome. I install node.js, then I clone the memory killer app using |


|
Interesting, #41047 does mention that the leaks were specific to Chrome. It may be worth checking again after next week's 14.0.0-next release which contains the |
|
The |
|
@crisbeto I upgraded the angular-memory-killer app to 14.0.0-next.4. Chrome and Microsoft Edge still leak memory in the same way described throughout this conversation. I've read that Chrome and Microsoft Edge are both built on top of the same rendering engine. I think there is a bug somewhere in the shared foundation between Chrome and Microsoft Edge, specifically with what internal references are placed on DOM nodes when If I use I feel like this information needs to be forwarded to the Chrome Dev Team, but I'm not exactly sure on how to go about doing that. |
|
Chromium bug: https://bugs.chromium.org/p/chromium/issues/detail?id=1308845 This issue has been fixed within the chromium browser. It hasn't been released yet, but it can be tested with Chrome's Canary browser: https://www.google.com/intl/en_ca/chrome/canary/ Broken Version 100.0.4896.60 (Official Build) (arm64) broken.mp4Fixed Version 102.0.4987.0 (Official Build) canary (arm64) fixed.mp4 |
|
@kevinpbaker thanks for the update! |
|
This issue has been automatically locked due to inactivity. Read more about our automatic conversation locking policy. This action has been performed automatically by a bot. |
Which @angular/* package(s) are the source of the bug?
Don't know / other
Is this a regression?
No
Description
Stack Overflow Post: https://stackoverflow.com/questions/71026959/memory-leak-garbage-collection-in-browser-not-collecting-components
Summary:
a. it will leak memory right away, and components won't be garbage collected (regularly or with the manual garbage collection button provided by most browsers for debugging purposes)
b. it won't leak memory right away, and it will happily garbage collect components regularly or with the manual garbage collection button provided by most browsers for debugging. After enough time has elapsed, or after you've restarted the app an arbitrary amount of times, it will eventually get into the memory leaking state
Please provide a link to a minimal reproduction of the bug
Repo: https://github.com/kevinpbaker/angular-memory-killer
S3 bucketed app: https://angular-memory-killer.s3.us-west-2.amazonaws.com/index.html
Please provide the exception or error you saw
Please provide the environment you discovered this bug in (run
ng version)Anything else?
I've included a link to a stack overflow post I made that adds additional information and pictures to show that it is indeed leaking memory.
Microsoft Edge has an experimental feature called "Detached Elements" that can be enabled to see any objects that are dangling and ready to be garbage collected. You can use this feature to visually see that the angular components aren't being garbage collected (I've also included screen shots of this in the stack overflow post).
The text was updated successfully, but these errors were encountered: